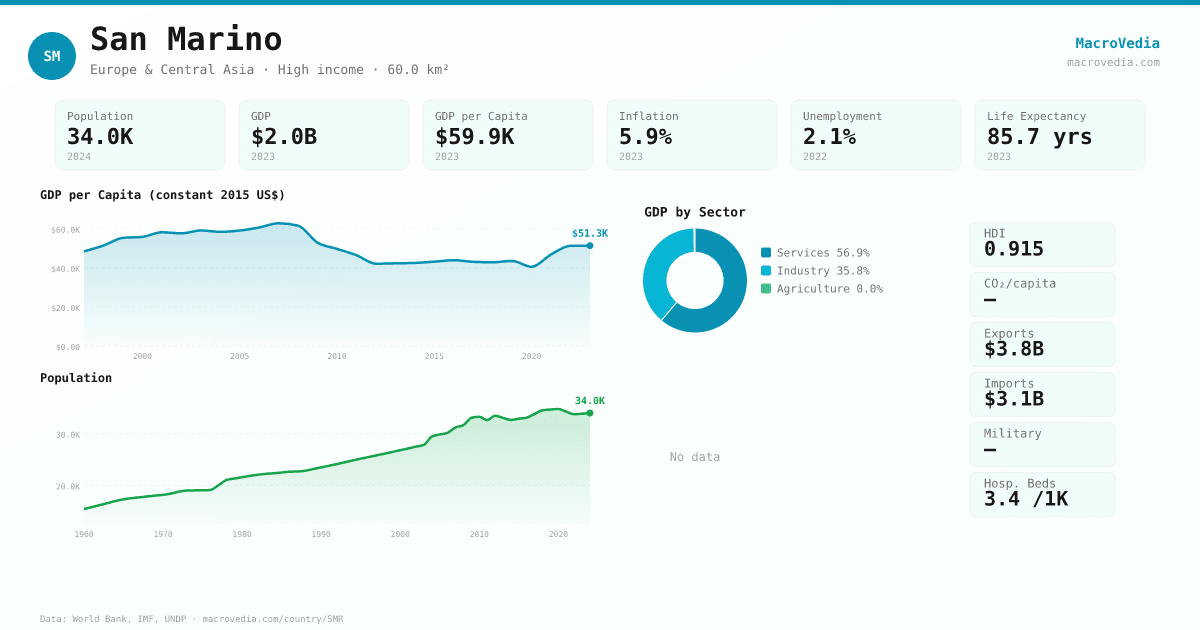
San Marino
SMR•Europe & Central Asia•High income
Country snapshot
Key indicators at a glance.
GDP
$2.39B
2026
GDP per capita
$69.49K
2026
Inflation
1.6%
2018
FX (LCU/USD)
0.8927
2025
Reserves
$338.96M
2018
Unemployment
4.02%
2022
Country snapshot
GDP
Latest
$2.46B
2027
vs prev
-5.96%
Prev: $2.62B
vs prev year
-5.96%
Back: $2.62B
Range
$1.54B → $2.7B
10Y
Generated by MacroVedia.comSource: Multiple sources
Series by topic
858 series across 16 topics.
Macro & GDP
UN DESAPopulation Growth Rate
0.09%
20261950 → 2026151 obs
0
20231960 → 202364 obs
0.34%
20241961 → 202464 obs
-0.52%
20241961 → 202464 obs
More series
0.37%
2024
WB WDILand area (sq. km)
60
2023
WB WDISurface area (sq. km)
60
2023
0
2023
0
2023
85
2023
$65.61M
2022
0%
2026
IMF WEOGDP deflator
140.06
2026
Prices & Monetary
IMF IFSConsumer Prices, Index
130.04
2024-122002-12 → 2024-12265 obs
IMF IFSConsumer Prices, % Change
1.59%
2024-122003-12 → 2024-12253 obs
IMF IFSDeposit Rate
1.86%
2025-032001 → 2025-03228 obs
115.95
2025-092010 → 2025-09189 obs
More series
IMF WEOConsumer prices, index
122.95
2026
123.99
2026
1.95%
2026
1.95%
2026
WB GEMCPI Price, nominal
133.28
2025
2.29%
2024
5.49%
2024
WB WDIReal interest rate (%)
-1.6%
2023
128.95
2024
Financial & Credit
412.64
20232004 → 202320 obs
122.01
20232004 → 202320 obs
5.94%
20232009 → 202315 obs
53.14%
20222009 → 202214 obs
More series
1.62K
2023
2.43%
2023
3.22%
2023
Trade & External
IMF IFSReserves excl. Gold
$676.58M
2025-041993 → 2025-04342 obs
IMF IFSTotal Reserves
$676.58M
2025-041993 → 2025-04342 obs
$836.09M
20231993 → 202331 obs
$836.09M
20231993 → 202331 obs
More series
$213.34B
2023
$432.26B
2023
Exchange Rates
IMF IFSExchange Rate, End of Period
0.8737
2025-071950 → 2025-07830 obs
IMF IFSExchange Rate (domestic/USD)
0.8564
2025-071971-09 → 2025-07647 obs
$1
20241972 → 202453 obs
0.8927
20251987 → 202539 obs
More series
0.8927
2025
0.8927
2025
IMF WEOPPP exchange rate
0.7
2026
$1
2024
1.87B
2023
178.12M
2023
WB WDIExpense (current LCU)
759.13M
2023
173.63M
2023
232M
2023
44.62M
2023
Demographics
UN DESABirths
195
20261950 → 2026151 obs
UN DESABirths to Women 15-19
0
20261950 → 2026151 obs
UN DESACrude Birth Rate
5.81
20261950 → 2026151 obs
UN DESACrude Death Rate
8.66
20261950 → 2026151 obs
More series
UN DESADeaths
291
2026
UN DESAFemale Deaths
146
2026
UN DESAInfant Mortality Rate
1.04
2026
86.03
2026
87.44
2026
84.54
2026
UN DESAMale Deaths
145
2026
UN DESAMean Age at Childbearing
32.85
2026
UN DESAMedian Age
49.06
2026
UN DESANatural Change
-96
2026
Labour
4.91%
20221979 → 202235 obs
6.87%
20221979 → 202234 obs
2.92%
20221979 → 202234 obs
IMF WEOUnemployment rate (%)
4.47%
20262001 → 202630 obs
More series
23.46%
2023
Health
88%
20241991 → 202434 obs
0
20242000 → 202425 obs
2
20241990 → 202425 obs
$3.92K
20232000 → 202324 obs
More series
Child Welfare
91
20242004 → 202413 obs
35
20242008 → 202412 obs
56
20242008 → 202412 obs
Education & R&D
5
20241970 → 202455 obs
8
20241970 → 202455 obs
3.77%
20211970 → 202152 obs
1.39K
20241971 → 202440 obs
More series
245
2024
92.24%
2024
1.68K
2024
UNDP HDRMean Years of Schooling
11.36
2023
7.05
2018
6.93
2018
50.53%
2018
1.55K
2018
44.14%
2018
44.46%
2018
Development
UNDP HDRGNI per Capita (PPP $)
64.71K
20231990 → 202334 obs
UNDP HDRGender Development Index
0.99
20232000 → 202324 obs
UNDP HDRHuman Development Index
0.92
20232000 → 202324 obs
$53.89K
20232017 → 20237 obs
More series
64.75K
2023
71.86K
2023
Governance
1.25
20231996 → 202325 obs
89.71%
20231996 → 202325 obs
1.25
20231996 → 202325 obs
1
20231996 → 202325 obs
More series
89.71%
2023
0.29
2023
WB WGIRule of Law — Estimate
1.48
2023
91.51%
2023
WB WDIRule of Law: Estimate
1.48
2023
1
2023
91.51%
2023
Humanitarian
5K
20021998 → 20024 obs
5
20052000 → 20053 obs
Environment & Energy
38.33%
20231961 → 202363 obs
23
20231961 → 202363 obs
33.08%
20231961 → 202363 obs
0.06
20231961 → 202363 obs
More series
Debt & Finance
IMF IFSLending Rate
5.46%
2025-032001 → 2025-03223 obs
1.26B
20262001 → 202630 obs
438M
20262004 → 202627 obs
-25M
20262004 → 202627 obs
More series
414M
2026
Infrastructure & ICT
16K
20221983 → 202240 obs
46.9
20221983 → 202240 obs
41K
20221990 → 202233 obs
120.27
20221990 → 202232 obs
More series
All series for SMR
Series
Topic / Source
Latest
Date
Obs
DemographicsWHO GHO
1.25
2023
39
DemographicsWHO GHO
1.54
2023
39
Environment & EnergyWB WDI
10.69
2020
31
DemographicsWB WDI
70.36%
2022
26
DemographicsWB WDI
70.47%
2022
26
DemographicsWHO GHO
88%
2024
25
DemographicsWB WDI
102.52%
2018
25
DemographicsWB WDI
70.58%
2022
25
DemographicsWHO GHO
85%
2024
25
DemographicsWB WDI
100%
2024
25
DemographicsWB WDI
100%
2024
25
DemographicsWB WDI
100%
2024
25
DemographicsWB WDI
100%
2024
25
LabourWB WDI
99.69%
2022
25
GovernanceWB WDI
71.57%
2023
25
GovernanceWB WDI
99.51%
2023
25
DemographicsWB WDI
100%
2023
24
DemographicsWB WDI
100%
2023
24
Environment & EnergyWB WDI
0
2023
24
Environment & EnergyWB WDI
-0.01
2023
24
Environment & EnergyWB WDI
-0.01
2023
24
HealthWB WDI
86.91%
2023
24
HealthWB WDI
26.2%
2023
24
HealthWB WDI
4.55K
2023
24
HealthWB WDI
684.85
2023
24
Trade & ExternalWB WDI
0%
2023
24
Trade & ExternalWB WDI
76.85%
2023
24
Trade & ExternalWB WDI
6.13%
2023
24
Trade & ExternalWB WDI
11.18%
2023
24
Trade & ExternalWB WDI
17.02%
2023
24
Trade & ExternalWB WDI
6.13%
2023
24
Trade & ExternalWB WDI
0%
2023
24
Trade & ExternalWB WDI
95.03%
2023
24
Trade & ExternalWB WDI
3.31%
2023
24
DemographicsWB WDI
15.7%
2023
24
DemographicsWB WDI
82
2023
24
Trade & ExternalWB WDI
9.4%
2023
23
Trade & ExternalWB WDI
2.8%
2023
22
Trade & ExternalWB WDI
0.08%
2022
22
Environment & EnergyWB WDI
0
2020
21
GovernanceWB WDI
71.56%
2023
21
GovernanceWB WDI
99.53%
2023
21
Macro & GDPWB WDI
70
2024
21
Trade & ExternalWB WDI
0.36%
2023
20
Macro & GDPWB WDI
36.37
2024
20
DemographicsWB WDI
25%
2022
19
DemographicsWB WDI
30.4%
2022
19
DemographicsWB WDI
27.89%
2022
19
DemographicsWB WDI
93.89%
2004
17
Trade & ExternalWB WDI
2.42%
2023
17
Trade & ExternalWB WDI
1.66%
2023
17
Trade & ExternalWB WDI
1.66%
2023
17
Trade & ExternalWB WDI
3.09%
2023
16
Trade & ExternalWB WDI
0.03%
2023
15
Education & R&DWB WDI
34.44%
2017
14
Education & R&DWB WDI
34.73%
2017
14
DemographicsWB WDI
87.17%
2000
12
DemographicsWB WDI
83.18%
2000
12
DemographicsWB WDI
5.87%
2024
12
DemographicsWB WDI
116%
2018
12
DemographicsWB WDI
90.48%
2018
12
Trade & ExternalWB WDI
0.26%
2023
12
Trade & ExternalWB WDI
0.11%
2023
12
Education & R&DWB WDI
100%
2024
12
GovernanceWB WDI
65.57%
2023
9
GovernanceWB WDI
96.7%
2023
9
Education & R&DWB WDI
99.9%
2023
9
Education & R&DWB WDI
99.84%
2023
9
Education & R&DWB WDI
99.63%
2023
9
Macro & GDPWB WDI
62.26%
2023
9
Macro & GDPWB WDI
99.06%
2023
9
Education & R&DWB WDI
12.99%
2023
9
Macro & GDPWB WDI
$20.79K
2023
9
Exchange RatesWB WDI
717.44M
2023
9
Macro & GDPWB WDI
858.78M
2023
9
Trade & ExternalWB WDI
0.06%
2023
9
GovernanceWB WDI
56.6%
2023
9
GovernanceWB WDI
95.28%
2023
9
Macro & GDPWB WDI
50
2024
9
Education & R&DWB WDI
100%
2024
9
Education & R&DWB WDI
100%
2024
9
Education & R&DWB WDI
6.83%
2017
8
Trade & ExternalWB WDI
0.06%
2023
8
Trade & ExternalWB WDI
59.5%
2023
7
Trade & ExternalWB WDI
37.51%
2023
7
Education & R&DWB WDI
97.88%
2023
7
Macro & GDPWB WDI
954.87M
2023
7
Financial & CreditWB WDI
2.43%
2023
7
Financial & CreditWB WDI
3.22%
2023
7
Exchange RatesWB WDI
-4.9M
2023
7
Education & R&DWB WDI
100%
2024
6
Education & R&DWB WDI
100%
2024
6
Education & R&DWB WDI
100%
2024
6
Macro & GDPWB WDI
60.73
2024
5
DemographicsWB WDI
19.66%
2022
4
DemographicsWB WDI
26.83%
2022
4
DemographicsWB WDI
23.5%
2022
4
Education & R&DWB WDI
0.97
2021
4
LabourWB WDI
6.54%
2022
4
LabourWB WDI
8.13%
2022
4
LabourWB WDI
4.02%
2022
4
LabourWB WDI
4.12%
2022
4
LabourWB WDI
6.89%
2022
4
LabourWB WDI
2.11%
2022
4
LabourWB WDI
5.66%
2022
4
LabourWB WDI
7.39%
2022
4
LabourWB WDI
3.86%
2022
4
DemographicsWB WDI
35.96%
2016
4
DemographicsWB WDI
21.44%
2016
4
DemographicsWB WDI
27.4%
2016
4
DemographicsWB WDI
19.65%
2022
3
DemographicsWB WDI
16.85%
2022
3
DemographicsWB WDI
18.39%
2022
3
DemographicsWB WDI
87.16%
2022
3
DemographicsWB WDI
88.35%
2022
3
DemographicsWB WDI
87.7%
2022
3
DemographicsWB WDI
19.65%
2022
3
DemographicsWB WDI
16.85%
2022
3
DemographicsWB WDI
18.39%
2022
3
DemographicsWB WDI
98.58%
2022
3
DemographicsWB WDI
99.29%
2022
3
DemographicsWB WDI
98.9%
2022
3
DemographicsWB WDI
19.65%
2022
3
DemographicsWB WDI
16.85%
2022
3
DemographicsWB WDI
18.39%
2022
3
DemographicsWB WDI
57.85%
2022
3
DemographicsWB WDI
59.48%
2022
3
DemographicsWB WDI
58.59%
2022
3
DemographicsWB WDI
77.18%
2022
3
DemographicsWB WDI
76.96%
2022
3
Labor force with advanced education, male (% of male working-age population with advanced education)
DemographicsWB WDI
77.52%
2022
3
DemographicsWB WDI
55.41%
2022
3
DemographicsWB WDI
52.9%
2022
3
DemographicsWB WDI
0%
2015
3
DemographicsWB WDI
0%
2015
3
DemographicsWB WDI
0%
2015
3
DemographicsWB WDI
13.56%
2022
2
DemographicsWB WDI
12.61%
2022
2
DemographicsWB WDI
13.13%
2022
2
DemographicsWB WDI
57.38%
2022
2
DemographicsWB WDI
70.78%
2022
2
DemographicsWB WDI
70.58%
2022
2
DemographicsWB WDI
70.99%
2022
2
DemographicsWB WDI
96.1%
2010
1