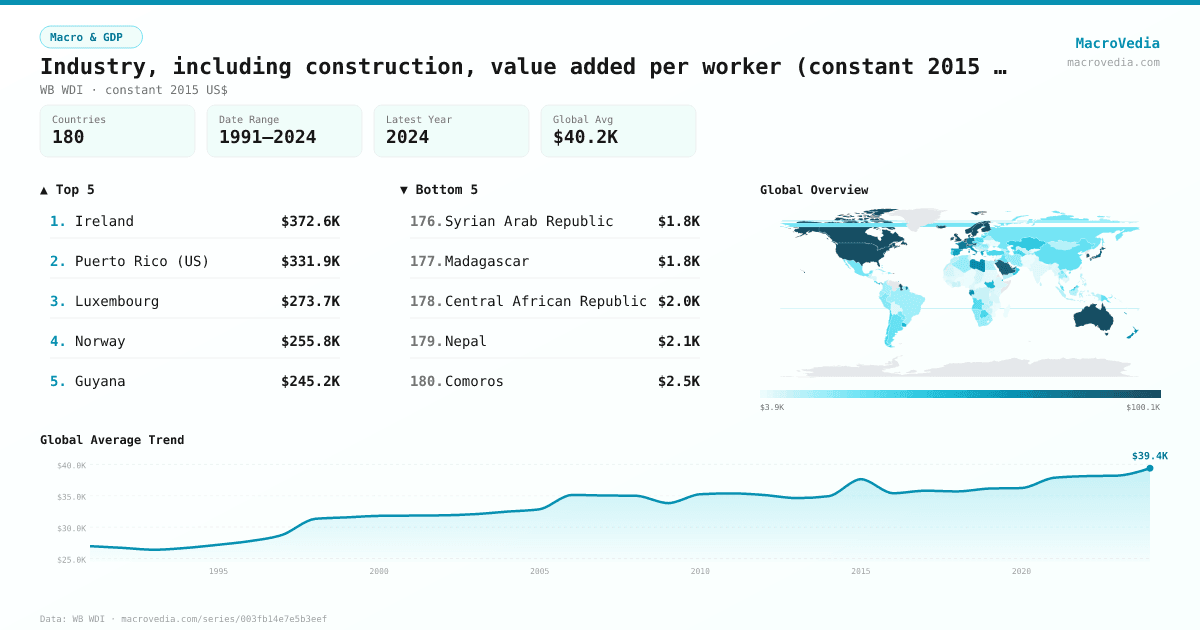
Industry, including construction, value added per worker (constant 2015 US$)
Macro & GDPWB WDIwb_wdi:NV.IND.EMPL.KD•constant 2015 US$•1991 → 2024•180 countries
Series quick facts
High-level context for this country series.
Macro & GDPWB WDI
Coverage
180
Frequency
yearly
Range
1991 \u2192 2024
Latest
2024
Industry, including construction, value added per worker (constant 2015 US$) by country
Latest available value per country (as of 2024)
Low \u2192 High
Unit: US$
≤ 5.68K
5.68K – 9.94K
9.94K – 15.46K
15.46K – 25.41K
25.41K – 37.34K
37.34K – 79.92K
> 79.92K
No data
Generated by MacroVedia.comSource: World Bank (WB WDI)
Highest 15 countries
Industry, including construction, value added per worker (constant 2015 US$)
50 countries with data
Generated by MacroVedia.comSource: World Bank (WB WDI)
Distribution across countries
Industry, including construction, value added per worker (constant 2015 US$)
Countries
50
Median
$84.35K
Mean
$105.86K
25th pctl
$51.53K
75th pctl
$116.02K
Generated by MacroVedia.comSource: World Bank (WB WDI)
Compare trends
Industry, including construction, value added per worker (constant 2015 US$)
NorwayGuyanaSwitzerland
Generated by MacroVedia.comSource: World Bank (WB WDI)
| Country | Latest | Date | Trend |
|---|---|---|---|
| IrelandIRL | $372.55K | 2024 | |
| Puerto Rico (US)PRI | $331.94K | 2015 | — |
| LuxembourgLUX | $273.69K | 2024 | |
| NorwayNOR | $255.75K | 2024 | |
| GuyanaGUY | $245.23K | 2024 | |
| SwitzerlandCHE | $222.92K | 2024 | |
| SingaporeSGP | $204.85K | 2024 | |
| Brunei DarussalamBRN | $172.21K | 2024 | |
| DenmarkDNK | $156.87K | 2024 | |
| SwedenSWE | $138.36K | 2024 | |
| AustraliaAUS | $122.71K | 2024 | |
| QatarQAT | $118.87K | 2024 | |
| NetherlandsNLD | $116.02K | 2024 | |
| United StatesUSA | $112.12K | 2015 | — |
| IsraelISR | $109.82K | 2024 | |
| IcelandISL | $104.86K | 2024 | |
| CanadaCAN | $102.53K | 2024 | |
| FinlandFIN | $100.33K | 2024 | |
| United KingdomGBR | $100.08K | 2024 | |
| Korea, Rep.KOR | $96K | 2024 | |
| BelgiumBEL | $94.46K | 2024 | |
| AustriaAUT | $92.79K | 2024 | |
| Saudi ArabiaSAU | $90.17K | 2024 | |
| JapanJPN | $87.03K | 2023 | |
| KuwaitKWT | $84.7K | 2024 | |
| United Arab EmiratesARE | $83.99K | 2024 | |
| GermanyDEU | $76.87K | 2024 | |
| FranceFRA | $74.58K | 2024 | |
| New ZealandNZL | $69.28K | 2023 | |
| ItalyITA | $68.26K | 2024 | |
| LibyaLBY | $67.33K | 2024 | |
| New CaledoniaNCL | $65.31K | 2015 | — |
| Equatorial GuineaGNQ | $64.92K | 2024 | |
| GabonGAB | $64.39K | 2024 | |
| SpainESP | $59.84K | 2024 | |
| GreeceGRC | $54.35K | 2024 | |
| PanamaPAN | $51.76K | 2024 | |
| SloveniaSVN | $51.53K | 2024 | |
| South SudanSSD | $50.64K | 2015 | |
| UruguayURY | $49.24K | 2024 | |
| Macao SAR, ChinaMAC | $48.49K | 2023 | |
| Trinidad and TobagoTTO | $47.04K | 2024 | |
| DjiboutiDJI | $46.86K | 2024 | |
| BahrainBHR | $45.59K | 2024 | |
| OmanOMN | $44.73K | 2024 | |
| Hong Kong SAR, ChinaHKG | $42.75K | 2024 | |
| KazakhstanKAZ | $42.47K | 2024 | |
| LithuaniaLTU | $39.66K | 2024 | |
| Costa RicaCRI | $38.31K | 2024 | |
| Bahamas, TheBHS | $38.01K | 2024 |
Source: World Bank (WB WDI)