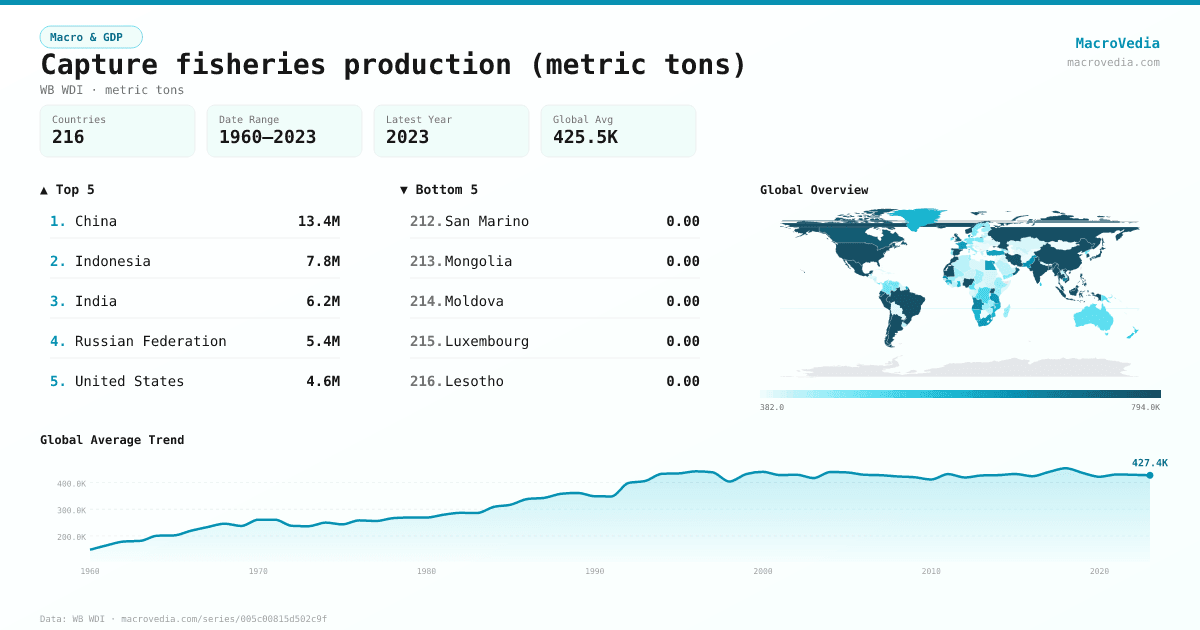
Capture fisheries production (metric tons)
Macro & GDPWB WDIwb_wdi:ER.FSH.CAPT.MT•metric tons•1960 → 2023•216 countries
Series quick facts
High-level context for this country series.
Macro & GDPWB WDI
Coverage
216
Frequency
yearly
Range
1960 \u2192 2023
Latest
2023
Capture fisheries production (metric tons) by country
Latest available value per country (as of 2023)
Low \u2192 High
Unit: metric tons
≤ 1.04K
1.04K – 4.51K
4.51K – 28.29K
28.29K – 66.58K
66.58K – 196.18K
196.18K – 607.04K
> 607.04K
No data
Generated by MacroVedia.comSource: World Bank (WB WDI)
Highest 15 countries
Capture fisheries production (metric tons)
50 countries with data
Generated by MacroVedia.comSource: World Bank (WB WDI)
Distribution across countries
Capture fisheries production (metric tons)
Countries
50
Median
765.6K
Mean
1.7M
25th pctl
482.7K
75th pctl
1.7M
Generated by MacroVedia.comSource: World Bank (WB WDI)
Compare trends
Capture fisheries production (metric tons)
ChinaIndonesiaIndia
Generated by MacroVedia.comSource: World Bank (WB WDI)
| Country | Latest | Date | Trend |
|---|---|---|---|
| ChinaCHN | 13.42M metric tons | 2023 | |
| IndonesiaIDN | 7.82M metric tons | 2023 | |
| IndiaIND | 6.18M metric tons | 2023 | |
| Russian FederationRUS | 5.4M metric tons | 2023 | |
| United StatesUSA | 4.62M metric tons | 2023 | |
| PeruPER | 3.52M metric tons | 2023 | |
| Viet NamVNM | 3.42M metric tons | 2023 | |
| JapanJPN | 2.9M metric tons | 2023 | |
| ChileCHL | 2.6M metric tons | 2023 | |
| NorwayNOR | 2.55M metric tons | 2023 | |
| BangladeshBGD | 2.06M metric tons | 2023 | |
| MexicoMEX | 1.85M metric tons | 2023 | |
| PhilippinesPHL | 1.72M metric tons | 2023 | |
| MyanmarMMR | 1.62M metric tons | 2023 | |
| ThailandTHA | 1.55M metric tons | 2023 | |
| MoroccoMAR | 1.44M metric tons | 2023 | |
| IcelandISL | 1.37M metric tons | 2023 | |
| Korea, Rep.KOR | 1.32M metric tons | 2023 | |
| MalaysiaMYS | 1.29M metric tons | 2023 | |
| ArgentinaARG | 836.23K metric tons | 2023 | |
| NigeriaNGA | 799.64K metric tons | 2023 | |
| MauritaniaMRT | 795.58K metric tons | 2023 | |
| Faroe IslandsFRO | 792.47K metric tons | 2023 | |
| BrazilBRA | 778.82K metric tons | 2023 | |
| SpainESP | 766.69K metric tons | 2023 | |
| Iran, Islamic Rep.IRN | 764.51K metric tons | 2023 | |
| CanadaCAN | 726.62K metric tons | 2023 | |
| United KingdomGBR | 717.39K metric tons | 2023 | |
| UgandaUGA | 716.51K metric tons | 2023 | |
| EcuadorECU | 694.99K metric tons | 2023 | |
| OmanOMN | 677.37K metric tons | 2023 | |
| ColombiaCOL | 578.92K metric tons | 2022 | |
| CambodiaKHM | 551.95K metric tons | 2023 | |
| AngolaAGO | 548.23K metric tons | 2023 | |
| SenegalSEN | 521.65K metric tons | 2023 | |
| PakistanPAK | 510K metric tons | 2023 | |
| DenmarkDNK | 495.29K metric tons | 2023 | |
| TanzaniaTZA | 482.7K metric tons | 2023 | |
| South AfricaZAF | 478.24K metric tons | 2023 | |
| FranceFRA | 472.22K metric tons | 2023 | |
| TurkiyeTUR | 454.06K metric tons | 2023 | |
| Egypt, Arab Rep.EGY | 448.72K metric tons | 2023 | |
| GuineaGIN | 414.21K metric tons | 2023 | |
| MozambiqueMOZ | 413.54K metric tons | 2023 | |
| GreenlandGRL | 397.29K metric tons | 2023 | |
| GhanaGHA | 384.37K metric tons | 2023 | |
| NamibiaNAM | 379.34K metric tons | 2023 | |
| Sri LankaLKA | 338.16K metric tons | 2023 | |
| New ZealandNZL | 327K metric tons | 2023 | |
| NetherlandsNLD | 267.56K metric tons | 2023 |
Source: World Bank (WB WDI)