Real Effective Exchange Rate
Financial & CreditWB GEMwb_gem:REER•Index•1994 → 2024•106 countries
Series quick facts
High-level context for this country series.
Financial & CreditWB GEM
Coverage
106
Frequency
yearly
Range
1994 \u2192 2024
Latest
2024
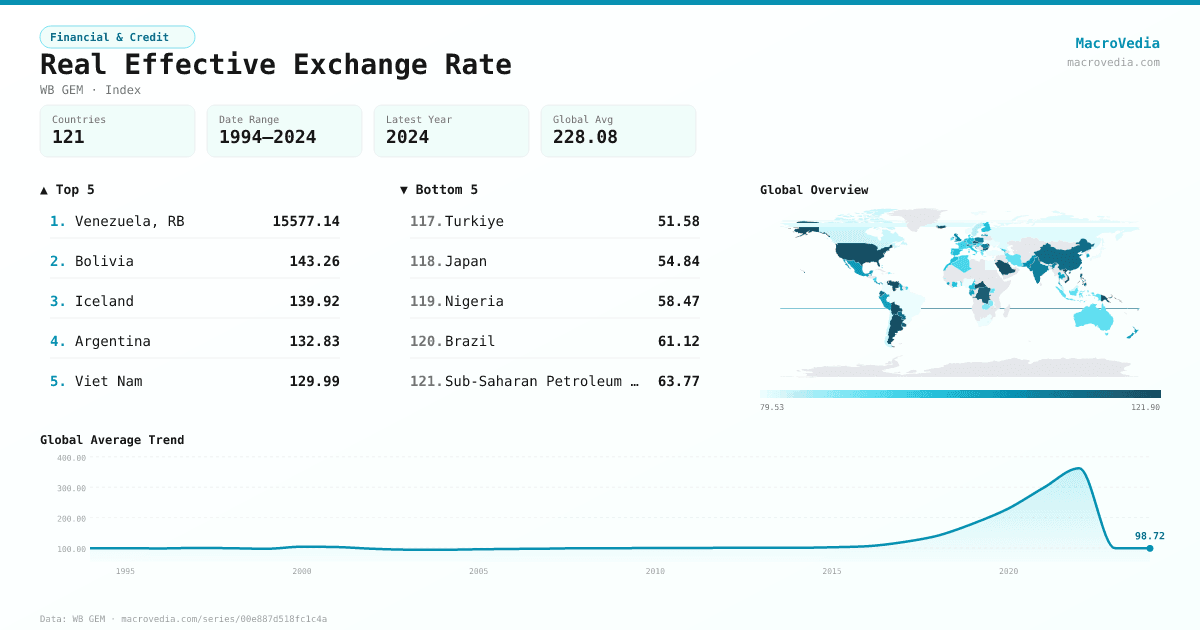
Real Effective Exchange Rate by country
Latest available value per country (as of 2024)
Low \u2192 High
Unit: Index
≤ 82.8
82.8 – 93.85
93.85 – 99.4
99.4 – 102.87
102.87 – 108.68
108.68 – 119.59
> 119.59
No data
Generated by MacroVedia.comSource: World Bank (WB GEM)
Highest 15 countries
Real Effective Exchange Rate
50 countries with data
Generated by MacroVedia.comSource: World Bank (WB GEM)
Distribution across countries
Real Effective Exchange Rate
Countries
50
Median
111.6
Mean
423.5
25th pctl
105
75th pctl
121.9
Generated by MacroVedia.comSource: World Bank (WB GEM)
Compare trends
Real Effective Exchange Rate
ArgentinaUnited StatesSaudi Arabia
Generated by MacroVedia.comSource: World Bank (WB GEM)
| Country | Latest | Date | Trend |
|---|---|---|---|
| Venezuela, RBVEN | 15,577.14 Index | 2022 | |
| BoliviaBOL | 143.26 Index | 2018 | |
| IcelandISL | 139.92 Index | 2018 | |
| ArgentinaARG | 132.83 Index | 2024 | |
| Viet NamVNM | 129.99 Index | 2024 | |
| Central African RepublicCAF | 127.93 Index | 2018 | |
| United StatesUSA | 127.79 Index | 2024 | |
| Solomon IslandsSLB | 126.54 Index | 2018 | |
| Saudi ArabiaSAU | 126.41 Index | 2024 | |
| Trinidad and TobagoTTO | 126.31 Index | 2018 | |
| Hong Kong SAR, ChinaHKG | 123.86 Index | 2024 | |
| MoldovaMDA | 122.36 Index | 2018 | |
| SingaporeSGP | 121.9 Index | 2024 | |
| Papua New GuineaPNG | 120.86 Index | 2018 | |
| KuwaitKWT | 120.75 Index | 2024 | |
| CzechiaCZE | 119.59 Index | 2024 | |
| BurundiBDI | 118.31 Index | 2018 | |
| Congo, Dem. Rep.COD | 118.21 Index | 2018 | |
| BulgariaBGR | 118.09 Index | 2024 | |
| PhilippinesPHL | 117.37 Index | 2024 | |
| UruguayURY | 116.75 Index | 2018 | |
| ChinaCHN | 114.33 Index | 2024 | |
| EcuadorECU | 113.55 Index | 2024 | |
| ParaguayPRY | 113.51 Index | 2018 | |
| FijiFJI | 112.7 Index | 2018 | |
| RomaniaROU | 110.58 Index | 2024 | |
| PolandPOL | 110.46 Index | 2024 | |
| IndiaIND | 110.2 Index | 2024 | |
| SwitzerlandCHE | 110.08 Index | 2024 | |
| BahrainBHR | 109.31 Index | 2018 | |
| United KingdomGBR | 108.68 Index | 2024 | |
| Antigua and BarbudaATG | 107.9 Index | 2018 | |
| PakistanPAK | 107.65 Index | 2024 | |
| NigeriaNGA | 107.52 Index | 2023 | |
| IsraelISR | 106.47 Index | 2024 | |
| Costa RicaCRI | 105.74 Index | 2018 | |
| PanamaPAN | 105.73 Index | 2024 | |
| MexicoMEX | 104.98 Index | 2024 | |
| GuyanaGUY | 104.61 Index | 2018 | |
| PeruPER | 104.5 Index | 2024 | |
| Equatorial GuineaGNQ | 104.39 Index | 2018 | |
| SamoaWSM | 104.38 Index | 2018 | |
| CroatiaHRV | 104.28 Index | 2024 | |
| St. Vincent and the GrenadinesVCT | 103.92 Index | 2018 | |
| GabonGAB | 103.15 Index | 2018 | |
| New ZealandNZL | 102.87 Index | 2018 | |
| LatviaLVA | 102.84 Index | 2018 | |
| AustriaAUT | 102.77 Index | 2018 | |
| St. LuciaLCA | 102.36 Index | 2018 | |
| DominicaDMA | 101.85 Index | 2018 |
Source: World Bank (WB GEM)