Expenditure on primary education (% of government expenditure on education)
Education & R&DWB WDIwb_wdi:SE.XPD.PRIM.ZS•nan•1970 → 2019•186 countries
Series quick facts
High-level context for this country series.
Education & R&DWB WDI
Coverage
186
Frequency
—
Range
1970 \u2192 2019
Latest
2018
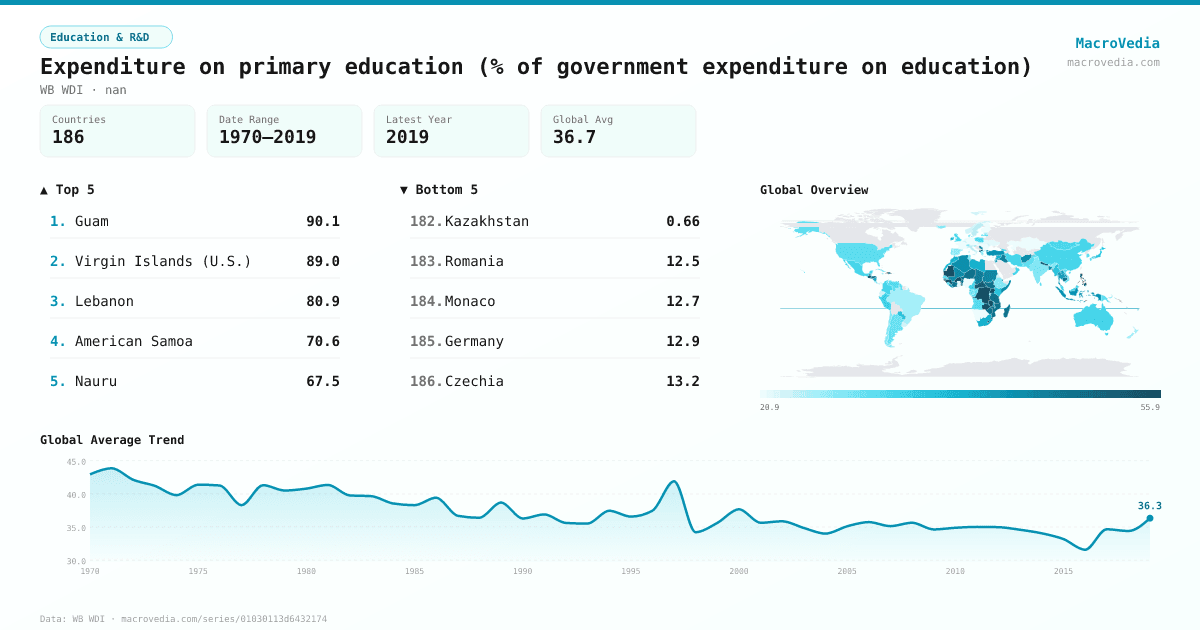
Expenditure on primary education (% of government expenditure on education) by country
Latest available value per country (as of 2018)
Low \u2192 High
Unit: %
≤ 23.09%
23.09% – 28.96%
28.96% – 32.25%
32.25% – 37.01%
37.01% – 44.61%
44.61% – 53.55%
> 53.55%
No data
Generated by MacroVedia.comSource: World Bank (WB WDI)
Highest 15 countries
Expenditure on primary education (% of government expenditure on education)
50 countries with data
Generated by MacroVedia.comSource: World Bank (WB WDI)
Distribution across countries
Expenditure on primary education (% of government expenditure on education)
Countries
50
Median
54.6%
Mean
55.6%
25th pctl
48.1%
75th pctl
58.9%
Generated by MacroVedia.comSource: World Bank (WB WDI)
Compare trends
Expenditure on primary education (% of government expenditure on education)
Cote d'IvoireZambiaEswatini
Generated by MacroVedia.comSource: World Bank (WB WDI)
| Country | Latest | Date | Trend |
|---|---|---|---|
| GuamGUM | 90.1% | 1973 | |
| Virgin Islands (U.S.)VIR | 89% | 1978 | |
| LebanonLBN | 80.93% | 1996 | |
| American SamoaASM | 70.56% | 1976 | |
| NauruNRU | 67.49% | 2002 | — |
| ZambiaZMB | 67.35% | 2017 | |
| Timor-LesteTLS | 64.89% | 2014 | |
| Guinea-BissauGNB | 64.42% | 2013 | |
| TogoTGO | 64.06% | 2016 | |
| GuineaGIN | 61.65% | 2018 | |
| Congo, Dem. Rep.COD | 61.59% | 2013 | |
| UgandaUGA | 59.16% | 2014 | |
| HaitiHTI | 58.92% | 1991 | |
| Dominican RepublicDOM | 58.68% | 2007 | |
| Burkina FasoBFA | 57.87% | 2015 | |
| AlbaniaALB | 57.61% | 2017 | |
| Solomon IslandsSLB | 56.29% | 1991 | |
| TuvaluTUV | 56.22% | 1997 | |
| LesothoLSO | 55.96% | 2018 | |
| MauritaniaMRT | 55.9% | 2016 | |
| Gambia, TheGMB | 55.84% | 2015 | |
| Sao Tome and PrincipeSTP | 55.82% | 2014 | |
| GuatemalaGTM | 55.6% | 2018 | |
| PhilippinesPHL | 54.98% | 2009 | |
| ComorosCOM | 54.61% | 2015 | |
| North MacedoniaMKD | 54.51% | 1996 | |
| NepalNPL | 53.77% | 2015 | |
| Central African RepublicCAF | 53.26% | 2010 | |
| EswatiniSWZ | 50.79% | 2014 | |
| BeninBEN | 49.81% | 2015 | |
| St. Kitts and NevisKNA | 49.29% | 1998 | |
| MozambiqueMOZ | 49.25% | 2013 | |
| TanzaniaTZA | 49.15% | 2014 | |
| HondurasHND | 48.9% | 2013 | |
| South SudanSSD | 48.58% | 2017 | |
| CambodiaKHM | 48.45% | 2014 | |
| NigerNER | 48.12% | 2017 | |
| QatarQAT | 48.06% | 1978 | |
| ZimbabweZWE | 47.77% | 2014 | |
| MadagascarMDG | 47.35% | 2012 | |
| Cote d'IvoireCIV | 47.29% | 2018 | |
| ChadTCD | 46.7% | 2012 | |
| IraqIRQ | 46.17% | 1989 | |
| El SalvadorSLV | 46.16% | 2018 | |
| Cayman IslandsCYM | 45.97% | 2006 | |
| DominicaDMA | 45.83% | 2015 | |
| Marshall IslandsMHL | 45.47% | 2002 | — |
| BurundiBDI | 45.43% | 2013 | |
| SerbiaSRB | 45.34% | 2015 | |
| SudanSDN | 45.08% | 1981 |
Source: World Bank (WB WDI)