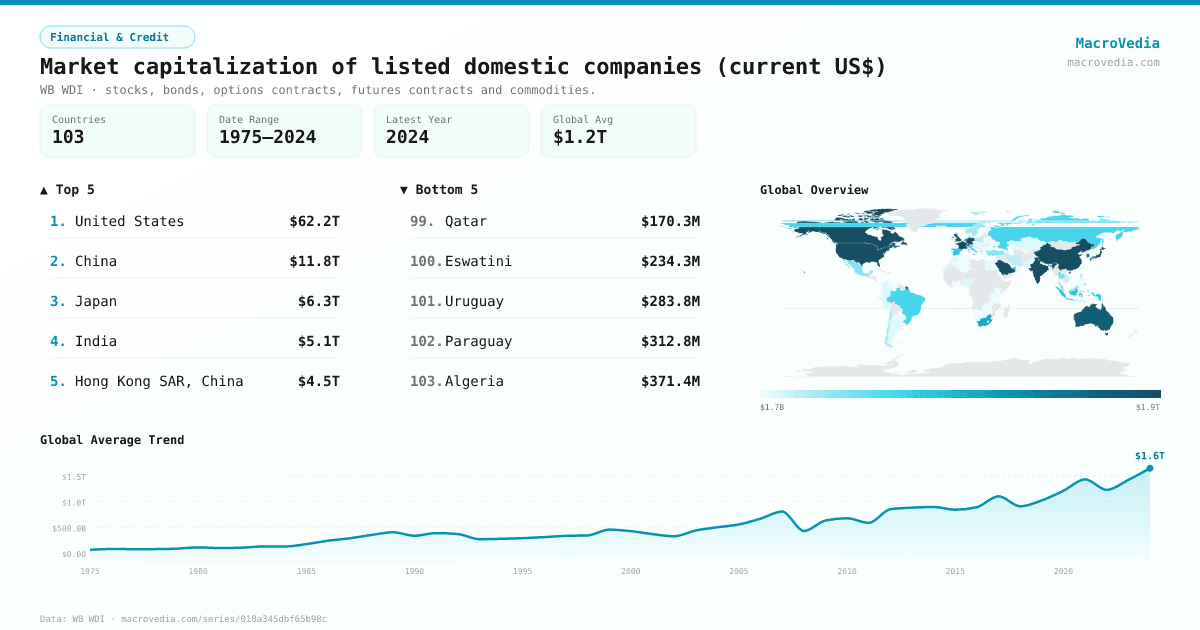
Market capitalization of listed domestic companies (current US$)
Financial & CreditWB WDIwb_wdi:CM.MKT.LCAP.CD•stocks, bonds, options contracts, futures contracts and commodities.•1975 → 2024•103 countries
Series quick facts
High-level context for this country series.
Financial & CreditWB WDI
Coverage
103
Frequency
yearly
Range
1975 \u2192 2024
Latest
2024
Market capitalization of listed domestic companies (current US$) by country
Latest available value per country (as of 2024)
Low \u2192 High
Unit: US$
≤ 2.77B
2.77B – 7.84B
7.84B – 24.15B
24.15B – 76.67B
76.67B – 294.74B
294.74B – 1.07T
> 1.07T
No data
Generated by MacroVedia.comSource: World Bank (WB WDI)
Highest 15 countries
Market capitalization of listed domestic companies (current US$)
50 countries with data
Generated by MacroVedia.comSource: World Bank (WB WDI)
Distribution across countries
Market capitalization of listed domestic companies (current US$)
Countries
50
Median
$433.54B
Mean
$2.47T
25th pctl
$141.48B
75th pctl
$1.74T
Generated by MacroVedia.comSource: World Bank (WB WDI)
Compare trends
Market capitalization of listed domestic companies (current US$)
United StatesJapanHong Kong SAR, China
Generated by MacroVedia.comSource: World Bank (WB WDI)
| Country | Latest | Date | Trend |
|---|---|---|---|
| United StatesUSA | $62.19T | 2024 | |
| ChinaCHN | $11.76T | 2024 | |
| JapanJPN | $6.31T | 2024 | |
| IndiaIND | $5.13T | 2024 | |
| Hong Kong SAR, ChinaHKG | $4.55T | 2024 | |
| CanadaCAN | $3.37T | 2024 | |
| United KingdomGBR | $3.1T | 2022 | |
| Saudi ArabiaSAU | $2.73T | 2024 | |
| FranceFRA | $2.37T | 2018 | |
| Iran, Islamic Rep.IRN | $2.06T | 2023 | |
| GermanyDEU | $2.04T | 2024 | |
| SwitzerlandCHE | $1.97T | 2024 | |
| AustraliaAUS | $1.74T | 2024 | |
| Korea, Rep.KOR | $1.56T | 2024 | |
| NetherlandsNLD | $1.1T | 2017 | |
| United Arab EmiratesARE | $1.05T | 2024 | |
| South AfricaZAF | $985.7B | 2024 | |
| IndonesiaIDN | $758.3B | 2023 | |
| SpainESP | $753.99B | 2024 | |
| BrazilBRA | $658.91B | 2024 | |
| Russian FederationRUS | $650.49B | 2023 | |
| SingaporeSGP | $637.63B | 2024 | |
| ItalyITA | $587.31B | 2014 | |
| ThailandTHA | $519.67B | 2024 | |
| MalaysiaMYS | $449.47B | 2024 | |
| MexicoMEX | $417.61B | 2024 | |
| TurkiyeTUR | $378.96B | 2024 | |
| IsraelISR | $330.88B | 2024 | |
| BelgiumBEL | $321.09B | 2018 | |
| NorwayNOR | $295.55B | 2019 | |
| SwedenSWE | $289.88B | 2003 | |
| ChileCHL | $262.01B | 2024 | |
| PhilippinesPHL | $251.83B | 2024 | |
| Viet NamVNM | $204.62B | 2024 | |
| PolandPOL | $197.36B | 2024 | |
| QatarQAT | $171.55B | 2023 | |
| DenmarkDNK | $151.35B | 2004 | |
| KuwaitKWT | $141.48B | 2024 | |
| AustriaAUT | $120.78B | 2024 | |
| IrelandIRL | $110.15B | 2018 | |
| New ZealandNZL | $92.87B | 2024 | |
| BangladeshBGD | $87.94B | 2024 | |
| GreeceGRC | $83.2B | 2024 | |
| PeruPER | $82.2B | 2024 | |
| MoroccoMAR | $74.46B | 2024 | |
| ColombiaCOL | $72.64B | 2024 | |
| KazakhstanKAZ | $62.82B | 2024 | |
| PortugalPRT | $61.93B | 2018 | |
| NigeriaNGA | $54.4B | 2024 | |
| ArgentinaARG | $52.95B | 2022 |
Source: World Bank (WB WDI)