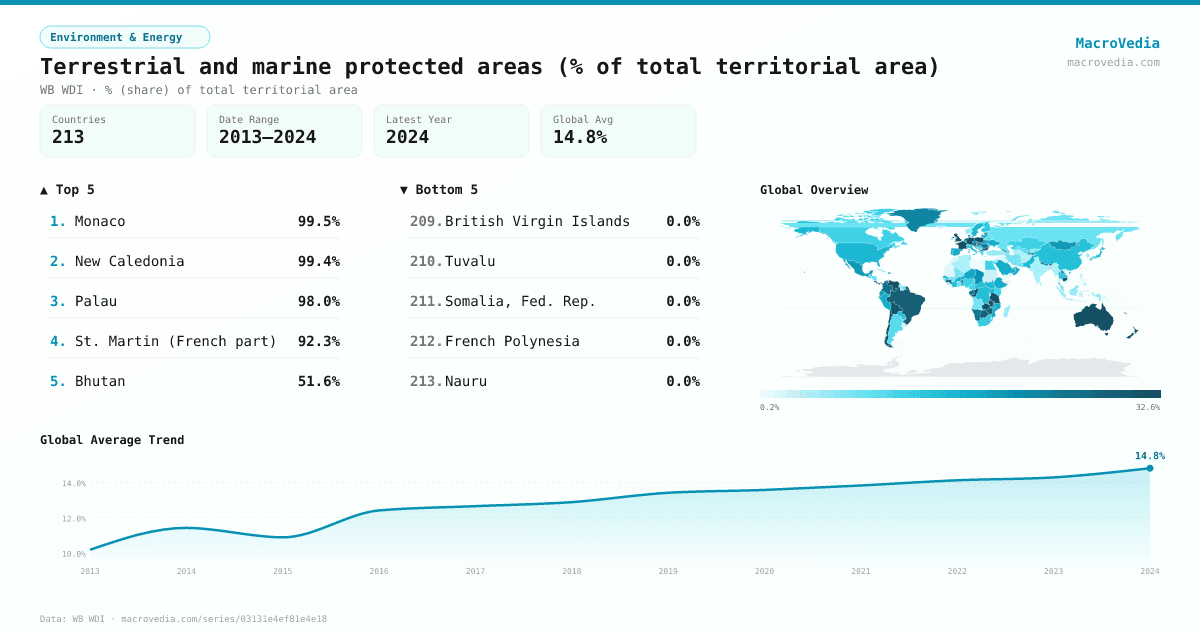
Terrestrial and marine protected areas (% of total territorial area)
Environment & EnergyWB WDIwb_wdi:ER.PTD.TOTL.ZS•% (share) of total territorial area•2013 → 2024•213 countries
Series quick facts
High-level context for this country series.
Environment & EnergyWB WDI
Coverage
213
Frequency
yearly
Range
2013 \u2192 2024
Latest
2024
Terrestrial and marine protected areas (% of total territorial area) by country
Latest available value per country (as of 2024)
Low \u2192 High
Unit: %
≤ 0.7%
0.7% – 4.16%
4.16% – 8.57%
8.57% – 13.57%
13.57% – 18.3%
18.3% – 28.87%
> 28.87%
No data
Generated by MacroVedia.comSource: World Bank (WB WDI)
Highest 15 countries
Terrestrial and marine protected areas (% of total territorial area)
50 countries with data
Generated by MacroVedia.comSource: World Bank (WB WDI)
Distribution across countries
Terrestrial and marine protected areas (% of total territorial area)
Countries
50
Median
31.4%
Mean
36.9%
25th pctl
26.4%
75th pctl
38.9%
Generated by MacroVedia.comSource: World Bank (WB WDI)
Compare trends
Terrestrial and marine protected areas (% of total territorial area)
MonacoNew CaledoniaPalau
Generated by MacroVedia.comSource: World Bank (WB WDI)
| Country | Latest | Date | Trend |
|---|---|---|---|
| MonacoMCO | 99.5% | 2024 | |
| New CaledoniaNCL | 99.4% | 2024 | |
| PalauPLW | 98% | 2024 | |
| St. Martin (French part)MAF | 92.3% | 2024 | |
| BhutanBTN | 51.6% | 2024 | |
| LiechtensteinLIE | 44.8% | 2024 | |
| United KingdomGBR | 42.1% | 2024 | |
| Hong Kong SAR, ChinaHKG | 42% | 2024 | |
| ZambiaZMB | 41.3% | 2024 | |
| SloveniaSVN | 40.2% | 2024 | |
| GermanyDEU | 40.1% | 2024 | |
| Venezuela, RBVEN | 39% | 2024 | |
| ArmeniaARM | 38.9% | 2024 | |
| LuxembourgLUX | 38.7% | 2024 | |
| PolandPOL | 38.2% | 2024 | |
| ChileCHL | 37.9% | 2024 | |
| Slovak RepublicSVK | 37.5% | 2024 | |
| FranceFRA | 36.8% | 2024 | |
| BulgariaBGR | 35.6% | 2024 | |
| AustraliaAUS | 33.5% | 2024 | |
| Congo, Rep.COG | 33.3% | 2024 | |
| SeychellesSYC | 32.6% | 2024 | |
| Northern Mariana IslandsMNP | 32.4% | 2024 | |
| TanzaniaTZA | 32.3% | 2024 | |
| CambodiaKHM | 31.8% | 2024 | |
| BoliviaBOL | 30.9% | 2024 | |
| New ZealandNZL | 30.6% | 2024 | |
| NetherlandsNLD | 29.8% | 2024 | |
| AustriaAUT | 29.6% | 2024 | |
| BrazilBRA | 29.4% | 2024 | |
| BotswanaBWA | 29.1% | 2024 | |
| ZimbabweZWE | 28.3% | 2024 | |
| Costa RicaCRI | 28.2% | 2024 | |
| North MacedoniaMKD | 28.2% | 2024 | |
| AndorraAND | 27.3% | 2024 | |
| PanamaPAN | 27.2% | 2024 | |
| BelizeBLZ | 26.8% | 2024 | |
| ColombiaCOL | 26.4% | 2024 | |
| GuineaGIN | 26.2% | 2024 | |
| GabonGAB | 24.5% | 2024 | |
| NamibiaNAM | 24.4% | 2024 | |
| RomaniaROU | 24.3% | 2024 | |
| CroatiaHRV | 24.1% | 2024 | |
| NepalNPL | 23.6% | 2024 | |
| BeninBEN | 23.5% | 2024 | |
| LesothoLSO | 23.4% | 2024 | |
| MalawiMWI | 23.1% | 2024 | |
| GreenlandGRL | 22.6% | 2024 | |
| HungaryHUN | 22.6% | 2024 | |
| TajikistanTJK | 22.6% | 2024 |
Source: World Bank (WB WDI)