B-READY: Labor Pillar 1: Quality of Labor Regulations
LabourWB WDIwb_wdi:IC.BRE.LB.P1•0-100 scale•2024 → 2024•50 countries
Series quick facts
High-level context for this country series.
LabourWB WDI
Coverage
50
Frequency
—
Range
2024 \u2192 2024
Latest
2024
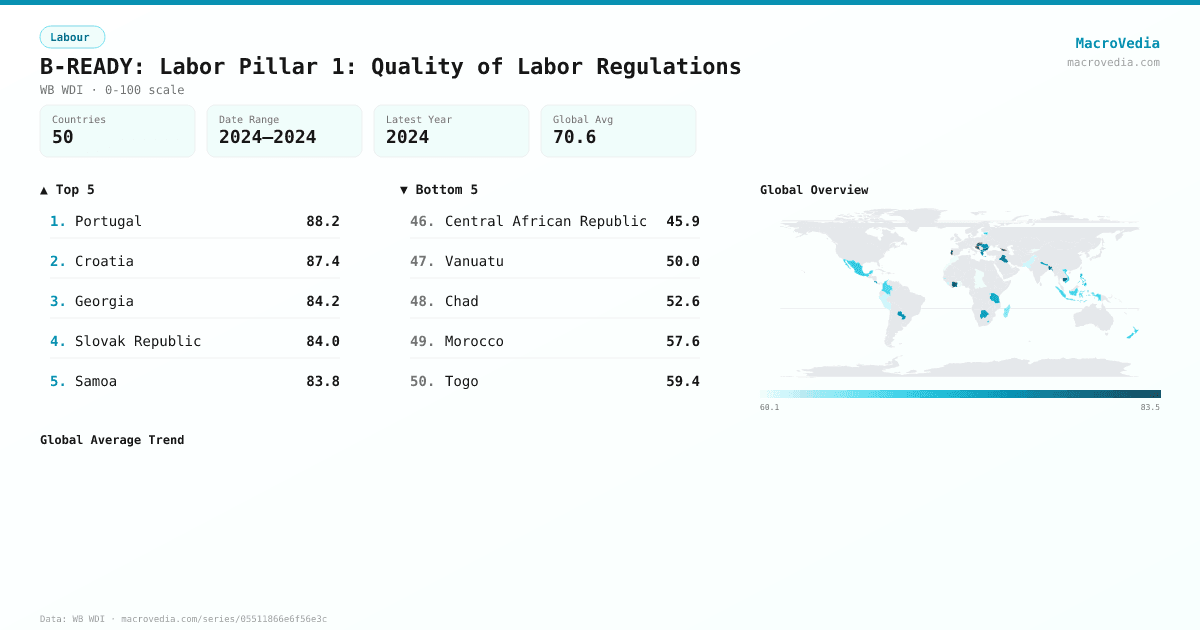
B-READY: Labor Pillar 1: Quality of Labor Regulations by country
Latest available value per country (as of 2024)
Low \u2192 High
Unit: 0-100 scale
≤ 60.46
60.46 – 66.85
66.85 – 68.7
68.7 – 72.19
72.19 – 76.8
76.8 – 80.66
> 80.66
No data
Generated by MacroVedia.comSource: World Bank (WB WDI)
Highest 15 countries
B-READY: Labor Pillar 1: Quality of Labor Regulations
50 countries with data
Generated by MacroVedia.comSource: World Bank (WB WDI)
Distribution across countries
B-READY: Labor Pillar 1: Quality of Labor Regulations
Countries
50
Median
69.9
Mean
70.6
25th pctl
64.9
75th pctl
77.7
Generated by MacroVedia.comSource: World Bank (WB WDI)
Compare trends
B-READY: Labor Pillar 1: Quality of Labor Regulations
PortugalCroatiaGeorgia
Generated by MacroVedia.comSource: World Bank (WB WDI)
| Country | Latest | Date | Trend |
|---|---|---|---|
| PortugalPRT | 88.23 0-100 scale | 2024 | — |
| CroatiaHRV | 87.39 0-100 scale | 2024 | — |
| GeorgiaGEO | 84.2 0-100 scale | 2024 | — |
| Slovak RepublicSVK | 84.01 0-100 scale | 2024 | — |
| SamoaWSM | 83.75 0-100 scale | 2024 | — |
| Bosnia and HerzegovinaBIH | 83.5 0-100 scale | 2024 | — |
| Cote d'IvoireCIV | 80.92 0-100 scale | 2024 | — |
| BulgariaBGR | 80.66 0-100 scale | 2024 | — |
| CambodiaKHM | 80.66 0-100 scale | 2024 | — |
| MontenegroMNE | 80.24 0-100 scale | 2024 | — |
| HungaryHUN | 80.2 0-100 scale | 2024 | — |
| BangladeshBGD | 78.71 0-100 scale | 2024 | — |
| IraqIRQ | 77.71 0-100 scale | 2024 | — |
| North MacedoniaMKD | 76.83 0-100 scale | 2024 | — |
| GreeceGRC | 76.8 0-100 scale | 2024 | — |
| RomaniaROU | 75.34 0-100 scale | 2024 | — |
| MauritiusMUS | 75.06 0-100 scale | 2024 | — |
| ParaguayPRY | 74.62 0-100 scale | 2024 | — |
| Costa RicaCRI | 74.32 0-100 scale | 2024 | — |
| BotswanaBWA | 73.88 0-100 scale | 2024 | — |
| NepalNPL | 72.67 0-100 scale | 2024 | — |
| TanzaniaTZA | 72.19 0-100 scale | 2024 | — |
| BarbadosBRB | 70.85 0-100 scale | 2024 | — |
| PhilippinesPHL | 70.53 0-100 scale | 2024 | — |
| LesothoLSO | 70.01 0-100 scale | 2024 | — |
| EstoniaEST | 69.83 0-100 scale | 2024 | — |
| Hong Kong SAR, ChinaHKG | 69.69 0-100 scale | 2024 | — |
| MexicoMEX | 69.22 0-100 scale | 2024 | — |
| Viet NamVNM | 68.7 0-100 scale | 2024 | — |
| Timor-LesteTLS | 68.58 0-100 scale | 2024 | — |
| New ZealandNZL | 68.18 0-100 scale | 2024 | — |
| ColombiaCOL | 67.44 0-100 scale | 2024 | — |
| SeychellesSYC | 67.38 0-100 scale | 2024 | — |
| IndonesiaIDN | 67.36 0-100 scale | 2024 | — |
| SingaporeSGP | 67.18 0-100 scale | 2024 | — |
| Gambia, TheGMB | 66.85 0-100 scale | 2024 | — |
| RwandaRWA | 65.32 0-100 scale | 2024 | — |
| MadagascarMDG | 64.94 0-100 scale | 2024 | — |
| West Bank and GazaPSE | 63.69 0-100 scale | 2024 | — |
| PeruPER | 61.42 0-100 scale | 2024 | — |
| PakistanPAK | 61.3 0-100 scale | 2024 | — |
| Sierra LeoneSLE | 61.08 0-100 scale | 2024 | — |
| GhanaGHA | 60.46 0-100 scale | 2024 | — |
| El SalvadorSLV | 60.34 0-100 scale | 2024 | — |
| Kyrgyz RepublicKGZ | 60.12 0-100 scale | 2024 | — |
| TogoTGO | 59.39 0-100 scale | 2024 | — |
| MoroccoMAR | 57.63 0-100 scale | 2024 | — |
| ChadTCD | 52.55 0-100 scale | 2024 | — |
| VanuatuVUT | 50.02 0-100 scale | 2024 | — |
| Central African RepublicCAF | 45.9 0-100 scale | 2024 | — |
Source: World Bank (WB WDI)