Firms experiencing electrical outages (% of firms)
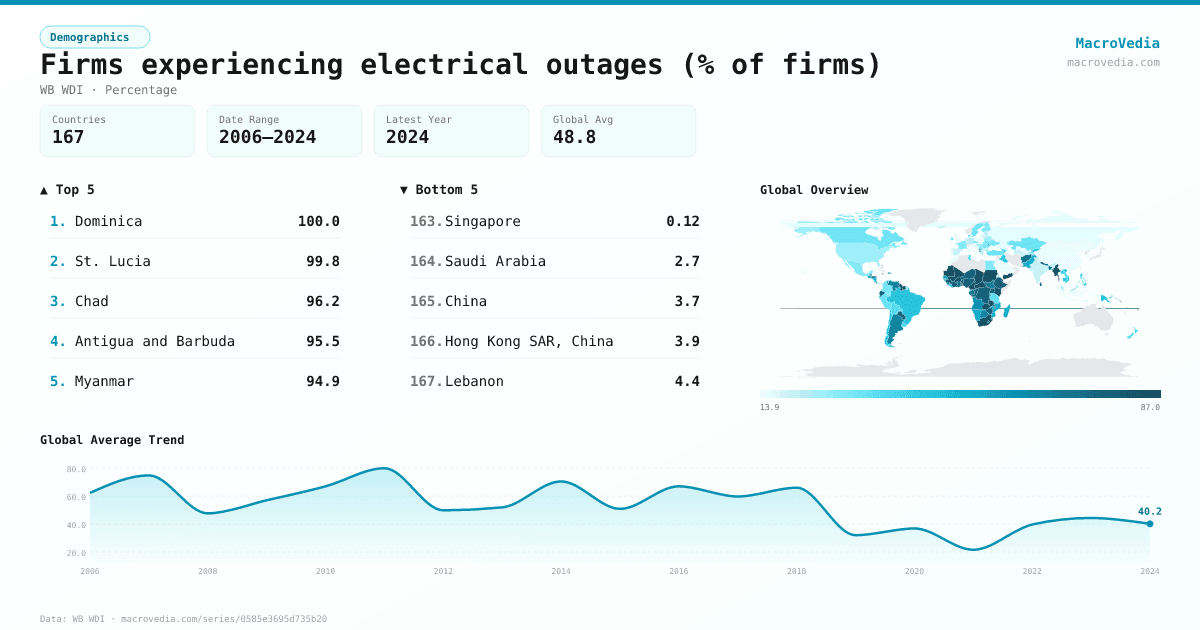
DemographicsWB WDIwb_wdi:IC.ELC.OUTG.ZS•Percentage•2006 → 2024•167 countries
Series quick facts
High-level context for this country series.
DemographicsWB WDI
Coverage
167
Frequency
—
Range
2006 \u2192 2024
Latest
2024
Firms experiencing electrical outages (% of firms) by country
Latest available value per country (as of 2024)
Low \u2192 High
Unit: %
≤ 20.77%
20.77% – 32.62%
32.62% – 43.97%
43.97% – 59.39%
59.39% – 75.8%
75.8% – 85.82%
> 85.82%
No data
Generated by MacroVedia.comSource: World Bank (WB WDI)
Highest 15 countries
Firms experiencing electrical outages (% of firms)
50 countries with data
Generated by MacroVedia.comSource: World Bank (WB WDI)
Distribution across countries
Firms experiencing electrical outages (% of firms)
Countries
50
Median
85.5%
Mean
85.6%
25th pctl
78.5%
75th pctl
92%
Generated by MacroVedia.comSource: World Bank (WB WDI)
Compare trends
Firms experiencing electrical outages (% of firms)
MaliLao PDRCongo, Dem. Rep.
Generated by MacroVedia.comSource: World Bank (WB WDI)
| Country | Latest | Date | Trend |
|---|---|---|---|
| DominicaDMA | 100% | 2010 | — |
| St. LuciaLCA | 99.79% | 2010 | — |
| Papua New GuineaPNG | 97.65% | 2015 | — |
| LebanonLBN | 97.13% | 2013 | — |
| ChadTCD | 96.17% | 2023 | |
| Antigua and BarbudaATG | 95.49% | 2010 | — |
| MyanmarMMR | 94.91% | 2016 | |
| St. Kitts and NevisKNA | 94.03% | 2010 | — |
| Yemen, Rep.YEM | 93.81% | 2013 | |
| SudanSDN | 93.72% | 2014 | — |
| CameroonCMR | 93.31% | 2024 | |
| Burkina FasoBFA | 92.49% | 2024 | |
| South AfricaZAF | 92.02% | 2020 | |
| MauritaniaMRT | 90.73% | 2014 | |
| Central African RepublicCAF | 89.28% | 2023 | |
| Solomon IslandsSLB | 88.8% | 2015 | — |
| JamaicaJAM | 87.59% | 2024 | |
| ZambiaZMB | 87.13% | 2019 | |
| MaliMLI | 87.1% | 2024 | |
| Gambia, TheGMB | 86.94% | 2023 | |
| TongaTON | 86.53% | 2024 | |
| BeninBEN | 86.15% | 2024 | |
| TogoTGO | 86.13% | 2023 | |
| SurinameSUR | 85.97% | 2018 | |
| TanzaniaTZA | 85.77% | 2013 | |
| Micronesia, Fed. Sts.FSM | 85.15% | 2009 | — |
| BurundiBDI | 85.05% | 2014 | |
| GuineaGIN | 84.19% | 2016 | |
| St. Vincent and the GrenadinesVCT | 83.31% | 2010 | — |
| MalawiMWI | 82.94% | 2014 | |
| KenyaKEN | 82.84% | 2018 | |
| FijiFJI | 81.83% | 2009 | — |
| GuyanaGUY | 81.81% | 2010 | — |
| UgandaUGA | 81.51% | 2013 | |
| Cote d'IvoireCIV | 80.35% | 2023 | |
| DjiboutiDJI | 80.24% | 2013 | — |
| EthiopiaETH | 80.04% | 2015 | |
| Lao PDRLAO | 78.52% | 2018 | |
| BelizeBLZ | 78.36% | 2010 | — |
| NigerNER | 78.03% | 2017 | |
| NigeriaNGA | 77.62% | 2014 | |
| Congo, Dem. Rep.COD | 77.36% | 2024 | |
| VanuatuVUT | 77.28% | 2023 | |
| IraqIRQ | 77.26% | 2011 | — |
| Congo, Rep.COG | 77.11% | 2024 | |
| ZimbabweZWE | 76.45% | 2016 | |
| Sri LankaLKA | 76.37% | 2011 | — |
| NepalNPL | 75.84% | 2023 | |
| PanamaPAN | 75.75% | 2006 | — |
| ParaguayPRY | 75.65% | 2023 |
Source: World Bank (WB WDI)