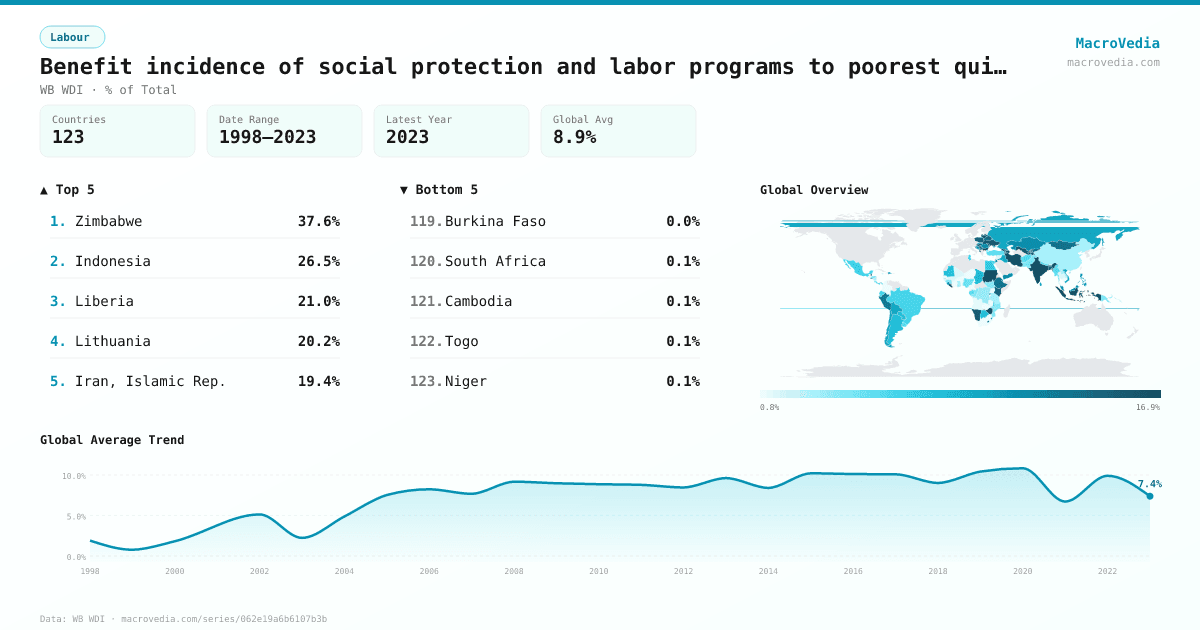
Benefit incidence of social protection and labor programs to poorest quintile (% of total SPL benefits)
LabourWB WDIwb_wdi:per_allsp.ben_q1_tot•% of Total•1998 → 2023•123 countries
Series quick facts
High-level context for this country series.
LabourWB WDI
Coverage
123
Frequency
—
Range
1998 \u2192 2023
Latest
2022
Benefit incidence of social protection and labor programs to poorest quintile (% of total SPL benefits) by country
Latest available value per country (as of 2022)
Low \u2192 High
Unit: %
≤ 1.82%
1.82% – 5.46%
5.46% – 7.62%
7.62% – 10.5%
10.5% – 13.17%
13.17% – 15.86%
> 15.86%
No data
Generated by MacroVedia.comSource: World Bank (WB WDI)
Highest 15 countries
Benefit incidence of social protection and labor programs to poorest quintile (% of total SPL benefits)
50 countries with data
Generated by MacroVedia.comSource: World Bank (WB WDI)
Distribution across countries
Benefit incidence of social protection and labor programs to poorest quintile (% of total SPL benefits)
Countries
50
Median
14.8%
Mean
15.6%
25th pctl
12.7%
75th pctl
17.3%
Generated by MacroVedia.comSource: World Bank (WB WDI)
Compare trends
Benefit incidence of social protection and labor programs to poorest quintile (% of total SPL benefits)
ArmeniaPeruEl Salvador
Generated by MacroVedia.comSource: World Bank (WB WDI)
| Country | Latest | Date | Trend |
|---|---|---|---|
| ZimbabweZWE | 37.55% | 2019 | |
| IndonesiaIDN | 26.47% | 2022 | |
| LiberiaLBR | 21.02% | 2016 | |
| LithuaniaLTU | 20.17% | 2008 | — |
| Iran, Islamic Rep.IRN | 19.36% | 2020 | |
| KosovoXKX | 18.95% | 2017 | |
| BelizeBLZ | 18.94% | 2009 | — |
| West Bank and GazaPSE | 18.79% | 2009 | — |
| GeorgiaGEO | 18.42% | 2021 | |
| BulgariaBGR | 18.18% | 2007 | — |
| SudanSDN | 17.98% | 2009 | — |
| MaldivesMDV | 17.36% | 2019 | |
| AzerbaijanAZE | 17.27% | 2015 | — |
| TajikistanTJK | 16.97% | 2011 | — |
| IndiaIND | 16.61% | 2011 | — |
| ArmeniaARM | 16.29% | 2022 | |
| UzbekistanUZB | 16.13% | 2018 | — |
| MoldovaMDA | 16.07% | 2018 | |
| UkraineUKR | 15.57% | 2020 | |
| LatviaLVA | 15.39% | 2009 | |
| HungaryHUN | 15.36% | 2007 | — |
| BangladeshBGD | 15.33% | 2022 | |
| NamibiaNAM | 15.32% | 2015 | — |
| KiribatiKIR | 15.28% | 2019 | — |
| PolandPOL | 14.91% | 2019 | |
| KenyaKEN | 14.62% | 2015 | |
| SerbiaSRB | 14.25% | 2022 | |
| BelarusBLR | 14.15% | 2019 | |
| El SalvadorSLV | 14.12% | 2022 | |
| JamaicaJAM | 14.05% | 2010 | |
| TunisiaTUN | 13.96% | 2015 | |
| Kyrgyz RepublicKGZ | 13.75% | 2020 | |
| MongoliaMNG | 13.59% | 2020 | |
| EthiopiaETH | 13.51% | 2018 | |
| AlbaniaALB | 13.46% | 2012 | |
| LesothoLSO | 13.12% | 2017 | — |
| RwandaRWA | 12.71% | 2013 | |
| PeruPER | 12.65% | 2022 | |
| CroatiaHRV | 12.44% | 2014 | |
| JordanJOR | 12.17% | 2010 | |
| GuatemalaGTM | 11.89% | 2011 | |
| Cote d'IvoireCIV | 11.87% | 2018 | |
| MalaysiaMYS | 11.86% | 2016 | |
| EswatiniSWZ | 11.85% | 2016 | |
| Bosnia and HerzegovinaBIH | 11.78% | 2015 | |
| Dominican RepublicDOM | 11.69% | 2021 | |
| RomaniaROU | 11.49% | 2021 | |
| Yemen, Rep.YEM | 11.45% | 2014 | |
| KazakhstanKAZ | 11.33% | 2021 | |
| PhilippinesPHL | 11.27% | 2018 |
Source: World Bank (WB WDI)