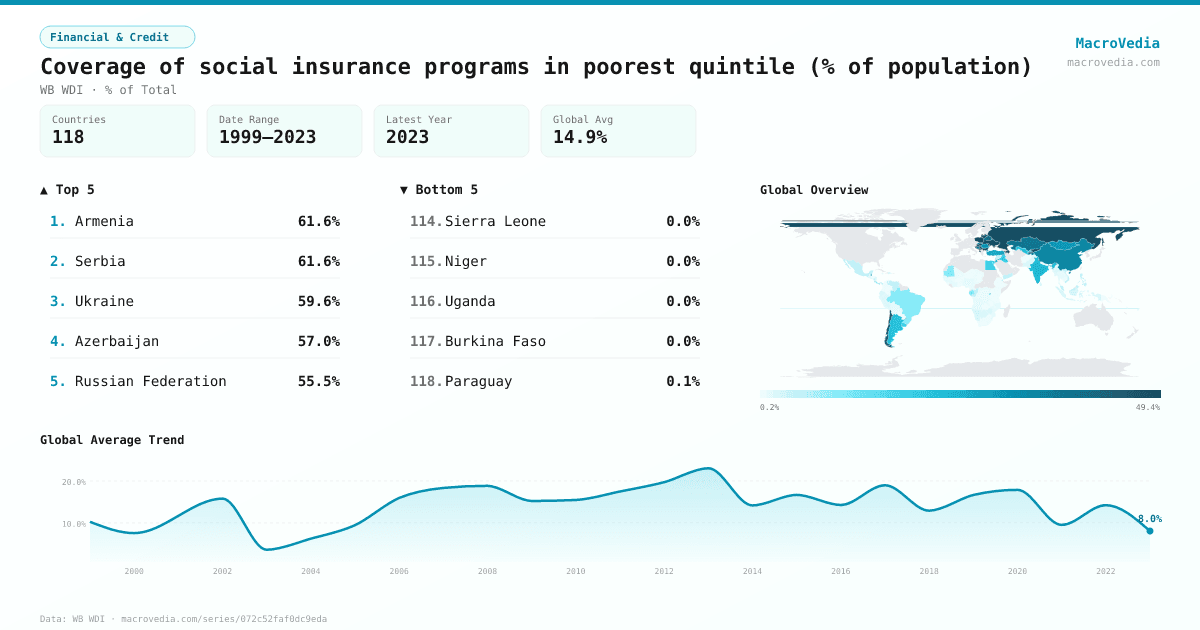
Coverage of social insurance programs in poorest quintile (% of population)
Financial & CreditWB WDIwb_wdi:per_si_allsi.cov_q1_tot•% of Total•1999 → 2023•118 countries
Series quick facts
High-level context for this country series.
Financial & CreditWB WDI
Coverage
118
Frequency
yearly
Range
1999 \u2192 2023
Latest
2023
Coverage of social insurance programs in poorest quintile (% of population) by country
Latest available value per country (as of 2023)
Low \u2192 High
Unit: %
≤ 0.46%
0.46% – 1.13%
1.13% – 2.73%
2.73% – 7.36%
7.36% – 23.27%
23.27% – 44.26%
> 44.26%
No data
Generated by MacroVedia.comSource: World Bank (WB WDI)
Highest 15 countries
Coverage of social insurance programs in poorest quintile (% of population)
50 countries with data
Generated by MacroVedia.comSource: World Bank (WB WDI)
Distribution across countries
Coverage of social insurance programs in poorest quintile (% of population)
Countries
50
Median
35.4%
Mean
34.1%
25th pctl
20.1%
75th pctl
49.5%
Generated by MacroVedia.comSource: World Bank (WB WDI)
Compare trends
Coverage of social insurance programs in poorest quintile (% of population)
TurkiyeArmeniaCosta Rica
Generated by MacroVedia.comSource: World Bank (WB WDI)
| Country | Latest | Date | Trend |
|---|---|---|---|
| ArmeniaARM | 61.64% | 2022 | |
| SerbiaSRB | 61.62% | 2022 | |
| GhanaGHA | 60.58% | 2012 | |
| UkraineUKR | 59.61% | 2020 | |
| AzerbaijanAZE | 56.98% | 2015 | — |
| Russian FederationRUS | 55.49% | 2017 | |
| CroatiaHRV | 52.85% | 2014 | |
| LithuaniaLTU | 52.56% | 2008 | — |
| MontenegroMNE | 51.86% | 2014 | |
| Kyrgyz RepublicKGZ | 49.92% | 2020 | |
| HungaryHUN | 49.86% | 2007 | — |
| MoldovaMDA | 49.67% | 2018 | |
| AlbaniaALB | 49.47% | 2018 | |
| PolandPOL | 49.33% | 2019 | |
| BulgariaBGR | 48.2% | 2007 | — |
| LatviaLVA | 46.84% | 2009 | |
| Marshall IslandsMHL | 45.96% | 2019 | |
| ChileCHL | 43.58% | 2022 | |
| BelarusBLR | 41.81% | 2019 | |
| TajikistanTJK | 39.02% | 2011 | — |
| PalauPLW | 38.9% | 2006 | — |
| KosovoXKX | 38.58% | 2017 | |
| KazakhstanKAZ | 37.5% | 2021 | |
| Bosnia and HerzegovinaBIH | 37.24% | 2015 | |
| Slovak RepublicSVK | 37.03% | 2009 | — |
| ChinaCHN | 33.87% | 2013 | — |
| SamoaWSM | 31.81% | 2008 | — |
| RomaniaROU | 30.81% | 2021 | |
| MongoliaMNG | 30% | 2020 | |
| BelizeBLZ | 29.37% | 2009 | — |
| TurkiyeTUR | 26.33% | 2019 | |
| JordanJOR | 24.92% | 2010 | |
| IndiaIND | 23.92% | 2011 | — |
| LebanonLBN | 23.83% | 2004 | — |
| KiribatiKIR | 22.52% | 2019 | — |
| ArgentinaARG | 21.17% | 2022 | |
| UzbekistanUZB | 20.78% | 2018 | — |
| IraqIRQ | 20.07% | 2012 | |
| UruguayURY | 19.69% | 2022 | |
| Egypt, Arab Rep.EGY | 17.73% | 2008 | — |
| RwandaRWA | 17.27% | 2013 | |
| DominicaDMA | 15.44% | 2002 | — |
| MauritiusMUS | 12.54% | 2017 | |
| GabonGAB | 11.45% | 2005 | — |
| Sao Tome and PrincipeSTP | 11.27% | 2017 | — |
| MauritaniaMRT | 10.45% | 2008 | — |
| BrazilBRA | 9.78% | 2022 | |
| Yemen, Rep.YEM | 9.13% | 2005 | — |
| Costa RicaCRI | 8.33% | 2022 | |
| PanamaPAN | 8.04% | 2023 |
Source: World Bank (WB WDI)