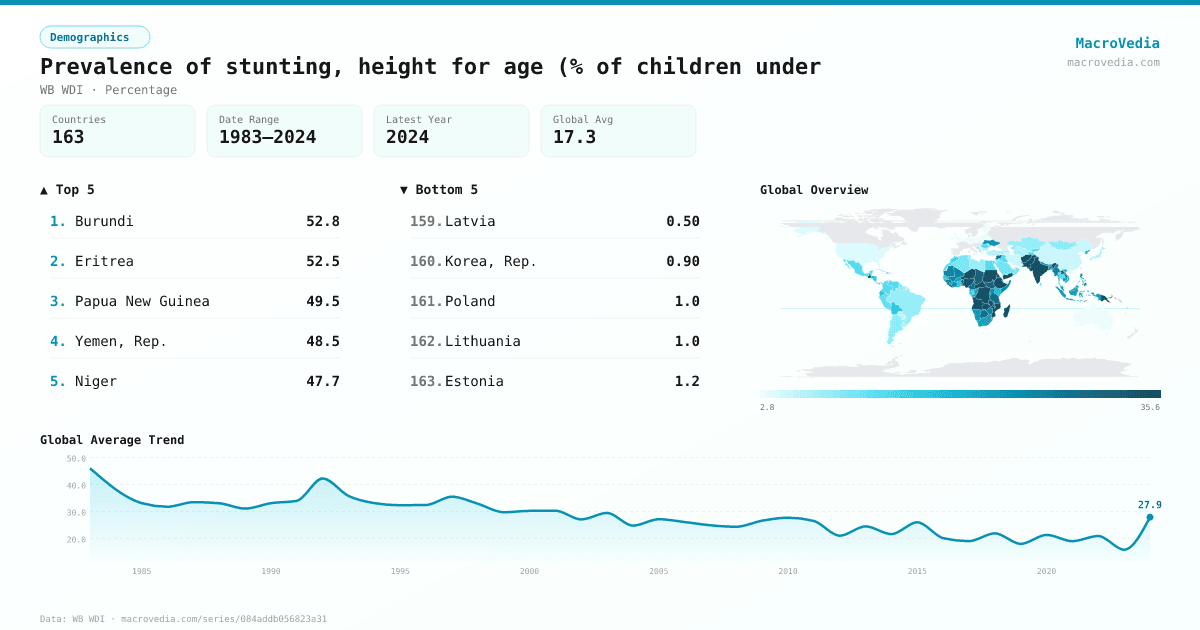
Prevalence of stunting, height for age (% of children under
DemographicsWB WDIwb_wdi:SH.STA.STNT.ZS•Percentage•1983 → 2024•163 countries
Series quick facts
High-level context for this country series.
DemographicsWB WDI
Coverage
163
Frequency
yearly
Range
1983 \u2192 2024
Latest
2024
Prevalence of stunting, height for age (% of children under by country
Latest available value per country (as of 2024)
Low \u2192 High
Unit: %
≤ 4.63%
4.63% – 8.49%
8.49% – 13.06%
13.06% – 19.83%
19.83% – 25.44%
25.44% – 34.06%
> 34.06%
No data
Generated by MacroVedia.comSource: World Bank (WB WDI)
Highest 15 countries
Prevalence of stunting, height for age (% of children under
50 countries with data
Generated by MacroVedia.comSource: World Bank (WB WDI)
Distribution across countries
Prevalence of stunting, height for age (% of children under
Countries
50
Median
33.7%
Mean
34.6%
25th pctl
28.1%
75th pctl
37.9%
Generated by MacroVedia.comSource: World Bank (WB WDI)
Compare trends
Prevalence of stunting, height for age (% of children under
NigerMalawiMali
Generated by MacroVedia.comSource: World Bank (WB WDI)
| Country | Latest | Date | Trend |
|---|---|---|---|
| BurundiBDI | 52.8% | 2024 | |
| EritreaERI | 52.5% | 2010 | |
| Papua New GuineaPNG | 49.5% | 2010 | |
| Yemen, Rep.YEM | 48.5% | 2022 | |
| NigerNER | 47.7% | 2022 | |
| Timor-LesteTLS | 46.7% | 2020 | |
| GuatemalaGTM | 46% | 2021 | |
| Congo, Dem. Rep.COD | 44.7% | 2023 | |
| AfghanistanAFG | 44.6% | 2022 | |
| MadagascarMDG | 39.8% | 2021 | |
| SudanSDN | 38.2% | 2014 | |
| LibyaLBY | 38.1% | 2014 | |
| Central African RepublicCAF | 37.9% | 2022 | |
| AngolaAGO | 37.6% | 2015 | |
| PakistanPAK | 37.6% | 2018 | |
| EthiopiaETH | 36.8% | 2019 | |
| MozambiqueMOZ | 36.7% | 2022 | |
| LesothoLSO | 35.6% | 2024 | |
| IndiaIND | 35.5% | 2020 | |
| MalawiMWI | 35.5% | 2020 | |
| Marshall IslandsMHL | 34.8% | 2017 | — |
| ZambiaZMB | 34.6% | 2018 | |
| KiribatiKIR | 34.4% | 1985 | — |
| BeninBEN | 34.1% | 2021 | |
| NigeriaNGA | 33.8% | 2021 | |
| BhutanBTN | 33.5% | 2010 | |
| RwandaRWA | 33.1% | 2020 | |
| Lao PDRLAO | 32.8% | 2023 | |
| ChadTCD | 31.9% | 2022 | |
| Solomon IslandsSLB | 31.7% | 2015 | |
| South SudanSSD | 31.3% | 2010 | |
| ComorosCOM | 31.1% | 2012 | |
| TanzaniaTZA | 30% | 2022 | |
| LiberiaLBR | 29.8% | 2019 | |
| BotswanaBWA | 28.9% | 2007 | |
| CameroonCMR | 28.9% | 2018 | |
| VanuatuVUT | 28.9% | 2013 | |
| Guinea-BissauGNB | 28.1% | 2019 | |
| Syrian Arab RepublicSYR | 27.9% | 2010 | |
| MauritiusMUS | 27.3% | 1985 | — |
| MyanmarMMR | 26.7% | 2018 | |
| PhilippinesPHL | 26.7% | 2021 | |
| Sierra LeoneSLE | 26.3% | 2021 | |
| Equatorial GuineaGNQ | 26.2% | 2011 | |
| GuineaGIN | 26.1% | 2022 | |
| ZimbabweZWE | 25.9% | 2024 | |
| DjiboutiDJI | 25.5% | 2023 | |
| Somalia, Fed. Rep.SOM | 25.3% | 2009 | |
| MaliMLI | 25.1% | 2024 | |
| MauritaniaMRT | 25.1% | 2022 |
Source: World Bank (WB WDI)