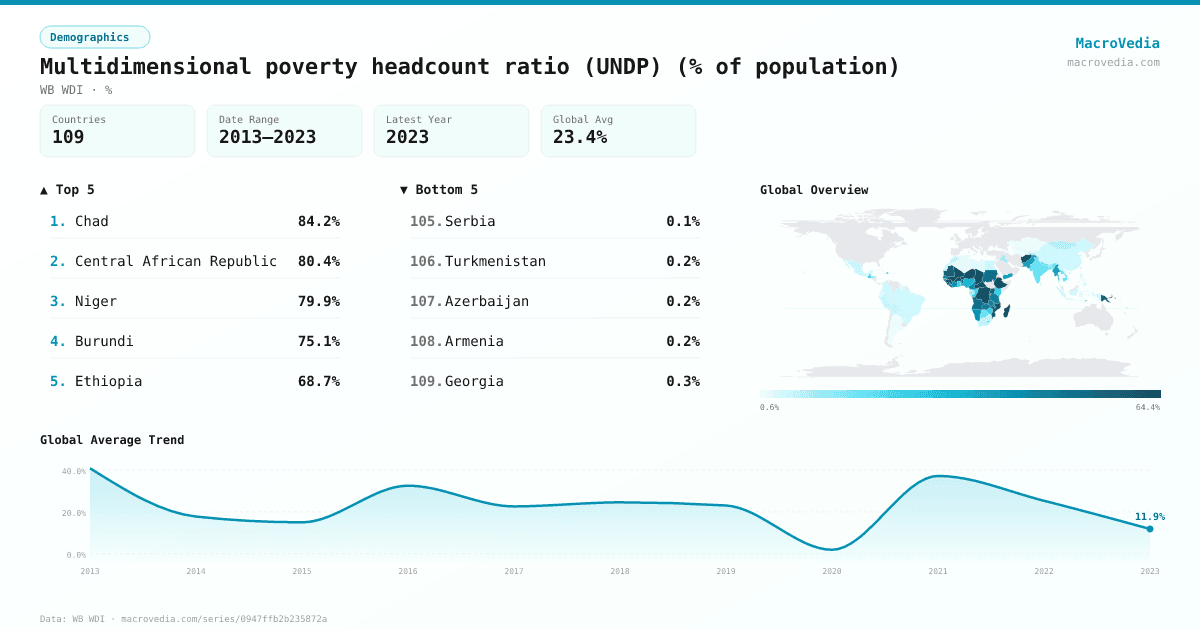
Multidimensional poverty headcount ratio (UNDP) (% of population)
DemographicsWB WDIwb_wdi:SI.POV.MPUN•%•2013 → 2023•109 countries
Series quick facts
High-level context for this country series.
DemographicsWB WDI
Coverage
109
Frequency
—
Range
2013 \u2192 2023
Latest
2023
Multidimensional poverty headcount ratio (UNDP) (% of population) by country
Latest available value per country (as of 2023)
Low \u2192 High
Unit: %
≤ 0.84%
0.84% – 2.89%
2.89% – 6.51%
6.51% – 18.8%
18.8% – 40.96%
40.96% – 56.94%
> 56.94%
No data
Generated by MacroVedia.comSource: World Bank (WB WDI)
Highest 15 countries
Multidimensional poverty headcount ratio (UNDP) (% of population)
50 countries with data
Generated by MacroVedia.comSource: World Bank (WB WDI)
Distribution across countries
Multidimensional poverty headcount ratio (UNDP) (% of population)
Countries
50
Median
47.6%
Mean
46.6%
25th pctl
28.9%
75th pctl
60.7%
Generated by MacroVedia.comSource: World Bank (WB WDI)
Compare trends
Multidimensional poverty headcount ratio (UNDP) (% of population)
ChadCentral African RepublicNiger
Generated by MacroVedia.comSource: World Bank (WB WDI)
| Country | Latest | Date | Trend |
|---|---|---|---|
| ChadTCD | 84.2% | 2019 | — |
| Central African RepublicCAF | 80.4% | 2018 | — |
| NigerNER | 79.9% | 2021 | — |
| BurundiBDI | 75.1% | 2016 | — |
| EthiopiaETH | 68.7% | 2019 | — |
| MadagascarMDG | 68.4% | 2021 | — |
| MaliMLI | 68.3% | 2018 | — |
| GuineaGIN | 66.2% | 2018 | — |
| AfghanistanAFG | 64.9% | 2022 | — |
| Burkina FasoBFA | 64.5% | 2021 | — |
| Congo, Dem. Rep.COD | 64.5% | 2017 | — |
| Guinea-BissauGNB | 64.4% | 2018 | — |
| MozambiqueMOZ | 60.7% | 2022 | — |
| Sierra LeoneSLE | 59.2% | 2019 | — |
| MauritaniaMRT | 58.4% | 2019 | — |
| UgandaUGA | 57.2% | 2016 | — |
| Papua New GuineaPNG | 56.6% | 2016 | — |
| BeninBEN | 55.9% | 2021 | — |
| LiberiaLBR | 52.3% | 2019 | — |
| SudanSDN | 52.3% | 2014 | — |
| AngolaAGO | 51.1% | 2015 | — |
| MalawiMWI | 49.9% | 2019 | — |
| RwandaRWA | 48.8% | 2019 | — |
| Timor-LesteTLS | 48.3% | 2016 | — |
| ZambiaZMB | 47.9% | 2018 | — |
| TanzaniaTZA | 47.2% | 2022 | — |
| SenegalSEN | 45.1% | 2023 | — |
| CameroonCMR | 43.6% | 2018 | — |
| Cote d'IvoireCIV | 42.8% | 2021 | — |
| Gambia, TheGMB | 41.7% | 2019 | — |
| HaitiHTI | 41.3% | 2016 | — |
| NamibiaNAM | 40.9% | 2013 | — |
| MyanmarMMR | 38.3% | 2015 | — |
| PakistanPAK | 38.3% | 2017 | — |
| TogoTGO | 37.6% | 2017 | — |
| Yemen, Rep.YEM | 37.4% | 2022 | — |
| NigeriaNGA | 33% | 2021 | — |
| GuatemalaGTM | 28.9% | 2014 | — |
| VanuatuVUT | 27.8% | 2023 | — |
| ZimbabweZWE | 25.8% | 2019 | — |
| KenyaKEN | 25.4% | 2022 | — |
| LesothoLSO | 25% | 2023 | — |
| GhanaGHA | 24.8% | 2022 | — |
| Congo, Rep.COG | 24.3% | 2014 | — |
| NepalNPL | 20.1% | 2022 | — |
| KiribatiKIR | 19.8% | 2018 | — |
| ComorosCOM | 19.2% | 2022 | — |
| Lao PDRLAO | 17.8% | 2023 | — |
| BotswanaBWA | 17.2% | 2015 | — |
| CambodiaKHM | 16.6% | 2021 | — |
Source: World Bank (WB WDI)