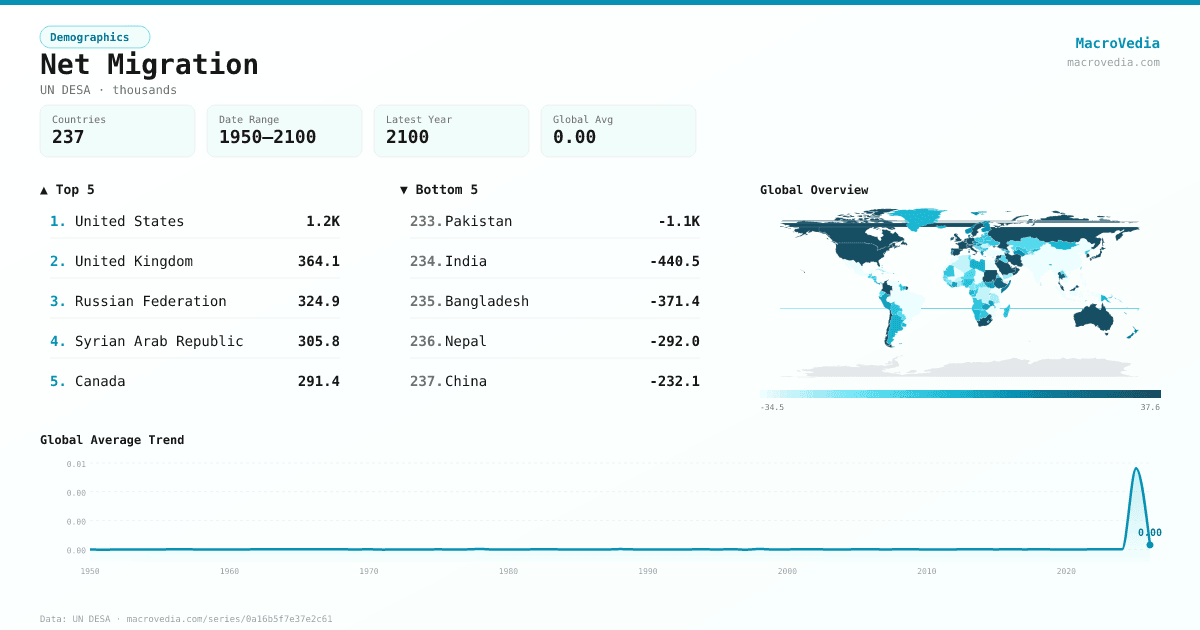
Net Migration
DemographicsUN DESAun_desa_pop:NetMigrations•thousands•1950 → 2026•225 countries
Series quick facts
High-level context for this country series.
DemographicsUN DESA
Coverage
225
Frequency
yearly
Range
1950 \u2192 2026
Latest
2026
Net Migration by country
Latest available value per country (as of 2026)
Low \u2192 High
Unit: thousands
≤ -25.28K
-25.28K – -6.32K
-6.32K – -1.7K
-1.7K – -9
-9 – 1.06K
1.06K – 16.97K
> 16.97K
No data
Generated by MacroVedia.comSource: UN Department of Economic and Social Affairs (UN DESA)
Highest 15 countries
Net Migration
50 countries with data
Generated by MacroVedia.comSource: UN Department of Economic and Social Affairs (UN DESA)
Distribution across countries
Net Migration
Countries
50
Median
33.1K
Mean
97.3K
25th pctl
13.4K
75th pctl
108.7K
Generated by MacroVedia.comSource: UN Department of Economic and Social Affairs (UN DESA)
Compare trends
Net Migration
United StatesUnited KingdomRussian Federation
Generated by MacroVedia.comSource: UN Department of Economic and Social Affairs (UN DESA)
| Country | Latest | Date | Trend |
|---|---|---|---|
| United StatesUSA | 1.18M thousands | 2026 | |
| United KingdomGBR | 364.1K thousands | 2026 | |
| Russian FederationRUS | 324.92K thousands | 2026 | |
| Syrian Arab RepublicSYR | 305.82K thousands | 2026 | |
| CanadaCAN | 291.4K thousands | 2026 | |
| SudanSDN | 252.04K thousands | 2026 | |
| MalaysiaMYS | 159K thousands | 2026 | |
| GermanyDEU | 158.44K thousands | 2026 | |
| AustraliaAUS | 131.71K thousands | 2026 | |
| South AfricaZAF | 131.68K thousands | 2026 | |
| JapanJPN | 128.62K thousands | 2026 | |
| ColombiaCOL | 115.82K thousands | 2026 | |
| Saudi ArabiaSAU | 108.66K thousands | 2026 | |
| NetherlandsNLD | 89.38K thousands | 2026 | |
| FranceFRA | 88.53K thousands | 2026 | |
| United Arab EmiratesARE | 87.4K thousands | 2026 | |
| SpainESP | 85.31K thousands | 2026 | |
| OmanOMN | 79.74K thousands | 2026 | |
| Iran, Islamic Rep.IRN | 66.85K thousands | 2026 | |
| Korea, Rep.KOR | 62.64K thousands | 2026 | |
| JordanJOR | 60.7K thousands | 2026 | |
| ItalyITA | 58.27K thousands | 2026 | |
| ChileCHL | 48.11K thousands | 2026 | |
| SwedenSWE | 42.76K thousands | 2026 | |
| SwitzerlandCHE | 34.1K thousands | 2026 | |
| IrelandIRL | 32.02K thousands | 2026 | |
| KuwaitKWT | 30.7K thousands | 2026 | |
| BelgiumBEL | 29.61K thousands | 2026 | |
| ThailandTHA | 29.2K thousands | 2026 | |
| EthiopiaETH | 27.3K thousands | 2026 | |
| QatarQAT | 24.79K thousands | 2026 | |
| DenmarkDNK | 18.36K thousands | 2026 | |
| PortugalPRT | 16.97K thousands | 2026 | |
| New ZealandNZL | 16.44K thousands | 2026 | |
| Somalia, Fed. Rep.SOM | 15.36K thousands | 2026 | |
| GreeceGRC | 14.65K thousands | 2026 | |
| BahrainBHR | 14.28K thousands | 2026 | |
| CzechiaCZE | 13.4K thousands | 2026 | |
| SingaporeSGP | 13.38K thousands | 2026 | |
| AustriaAUT | 13.21K thousands | 2026 | |
| IsraelISR | 13.02K thousands | 2026 | |
| HungaryHUN | 12.94K thousands | 2026 | |
| FinlandFIN | 12.67K thousands | 2026 | |
| NorwayNOR | 12.05K thousands | 2026 | |
| TurkmenistanTKM | 11.79K thousands | 2026 | |
| South SudanSSD | 7.97K thousands | 2026 | |
| AzerbaijanAZE | 7.71K thousands | 2026 | |
| CyprusCYP | 7.21K thousands | 2026 | |
| ZambiaZMB | 6.94K thousands | 2026 | |
| PeruPER | 6.71K thousands | 2026 |
Source: UN Department of Economic and Social Affairs (UN DESA)