Listed domestic companies, total
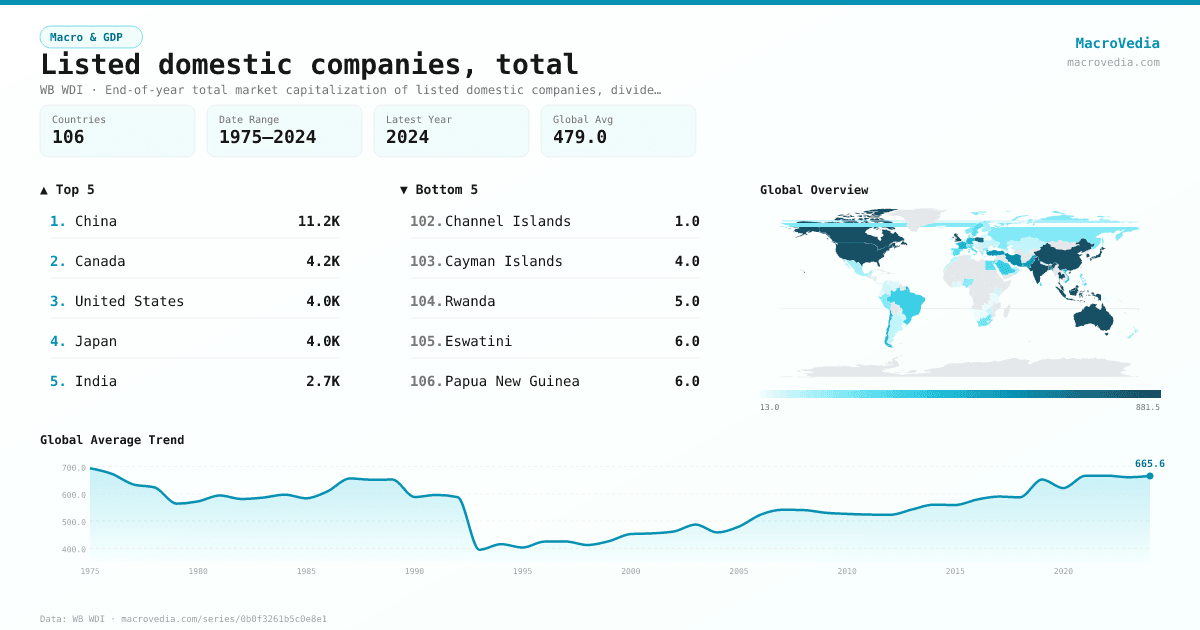
Macro & GDPWB WDIwb_wdi:CM.MKT.LDOM.NO•End-of-year total market capitalization of listed domestic companies, divided by gross domestic product, expressed as a percentage. (percentile)•1975 → 2024•106 countries
Series quick facts
High-level context for this country series.
Macro & GDPWB WDI
Coverage
106
Frequency
yearly
Range
1975 \u2192 2024
Latest
2024
Listed domestic companies, total by country
Latest available value per country (as of 2024)
Low \u2192 High
Unit: %
≤ 20%
20% – 40%
40% – 76%
76% – 117%
117% – 246%
246% – 594%
> 594%
No data
Generated by MacroVedia.comSource: World Bank (WB WDI)
Highest 15 countries
Listed domestic companies, total
50 countries with data
Generated by MacroVedia.comSource: World Bank (WB WDI)
Distribution across countries
Listed domestic companies, total
Countries
50
Median
341.5%
Mean
978.7%
25th pctl
176%
75th pctl
773%
Generated by MacroVedia.comSource: World Bank (WB WDI)
Compare trends
Listed domestic companies, total
CanadaUnited StatesJapan
Generated by MacroVedia.comSource: World Bank (WB WDI)
| Country | Latest | Date | Trend |
|---|---|---|---|
| ChinaCHN | 11,231% | 2024 | |
| CanadaCAN | 4,226% | 2024 | |
| United StatesUSA | 4,010% | 2024 | |
| JapanJPN | 3,971% | 2024 | |
| IndiaIND | 2,673% | 2024 | |
| Korea, Rep.KOR | 2,599% | 2024 | |
| Hong Kong SAR, ChinaHKG | 2,449% | 2024 | |
| AustraliaAUS | 1,853% | 2024 | |
| United KingdomGBR | 1,606% | 2022 | |
| MalaysiaMYS | 1,031% | 2024 | |
| IndonesiaIDN | 903% | 2023 | |
| ThailandTHA | 860% | 2024 | |
| SpainESP | 773% | 2023 | |
| PolandPOL | 749% | 2024 | |
| BangladeshBGD | 691% | 2024 | |
| Iran, Islamic Rep.IRN | 594% | 2024 | |
| TurkiyeTUR | 551% | 2024 | |
| PakistanPAK | 530% | 2024 | |
| IsraelISR | 511% | 2024 | |
| FranceFRA | 457% | 2018 | |
| ChileCHL | 437% | 2024 | |
| GermanyDEU | 435% | 2024 | |
| SingaporeSGP | 400% | 2024 | |
| Viet NamVNM | 393% | 2024 | |
| Saudi ArabiaSAU | 352% | 2024 | |
| BrazilBRA | 331% | 2024 | |
| ItalyITA | 290% | 2014 | |
| Sri LankaLKA | 284% | 2024 | |
| PhilippinesPHL | 280% | 2024 | |
| SwedenSWE | 278% | 2002 | |
| Egypt, Arab Rep.EGY | 246% | 2024 | |
| South AfricaZAF | 220% | 2024 | |
| SwitzerlandCHE | 206% | 2024 | |
| BulgariaBGR | 204% | 2024 | |
| Russian FederationRUS | 194% | 2023 | |
| NorwayNOR | 180% | 2017 | |
| DenmarkDNK | 178% | 2004 | |
| PeruPER | 176% | 2024 | |
| NigeriaNGA | 169% | 2024 | |
| JordanJOR | 162% | 2024 | |
| United Arab EmiratesARE | 154% | 2024 | |
| GreeceGRC | 143% | 2024 | |
| KuwaitKWT | 138% | 2024 | |
| FinlandFIN | 134% | 2004 | |
| MexicoMEX | 129% | 2024 | |
| BelgiumBEL | 117% | 2015 | |
| MontenegroMNE | 112% | 2012 | |
| New ZealandNZL | 112% | 2024 | |
| OmanOMN | 110% | 2022 | |
| HondurasHND | 104% | 1998 |
Source: World Bank (WB WDI)