Share of youth not in education, employment or training, female (% of female youth population)
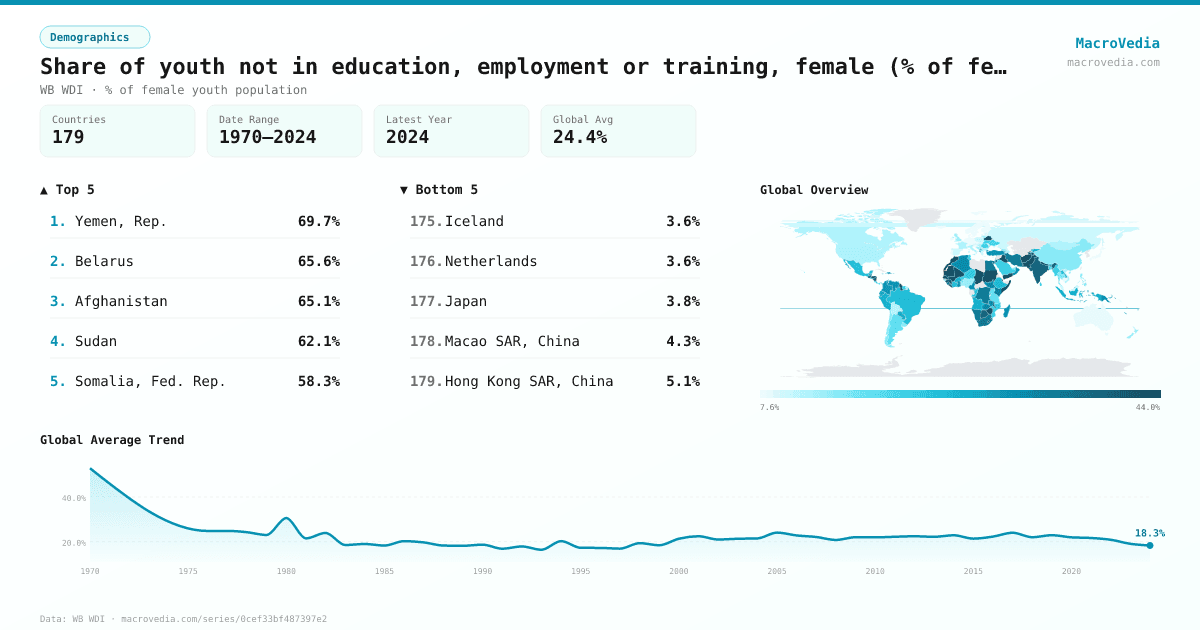
DemographicsWB WDIwb_wdi:SL.UEM.NEET.FE.ZS•% of female youth population•1970 → 2024•179 countries
Series quick facts
High-level context for this country series.
DemographicsWB WDI
Coverage
179
Frequency
—
Range
1970 \u2192 2024
Latest
2024
Share of youth not in education, employment or training, female (% of female youth population) by country
Latest available value per country (as of 2024)
Low \u2192 High
Unit: %
≤ 8.82%
8.82% – 14.65%
14.65% – 20.39%
20.39% – 25.86%
25.86% – 31.75%
31.75% – 41.79%
> 41.79%
No data
Generated by MacroVedia.comSource: World Bank (WB WDI)
Highest 15 countries
Share of youth not in education, employment or training, female (% of female youth population)
50 countries with data
Generated by MacroVedia.comSource: World Bank (WB WDI)
Distribution across countries
Share of youth not in education, employment or training, female (% of female youth population)
Countries
50
Median
42.4%
Mean
44.3%
25th pctl
34.8%
75th pctl
52.7%
Generated by MacroVedia.comSource: World Bank (WB WDI)
Compare trends
Share of youth not in education, employment or training, female (% of female youth population)
South AfricaIran, Islamic Rep.Honduras
Generated by MacroVedia.comSource: World Bank (WB WDI)
| Country | Latest | Date | Trend |
|---|---|---|---|
| Yemen, Rep.YEM | 69.69% | 2014 | — |
| BelarusBLR | 65.63% | 2024 | |
| AfghanistanAFG | 65.08% | 2021 | |
| Solomon IslandsSLB | 62.57% | 1999 | — |
| SudanSDN | 62.06% | 2022 | |
| Somalia, Fed. Rep.SOM | 58.31% | 2022 | |
| TajikistanTJK | 57.63% | 2016 | |
| PakistanPAK | 56.42% | 2021 | |
| MauritaniaMRT | 54.85% | 2019 | |
| DjiboutiDJI | 54.31% | 2017 | — |
| MoroccoMAR | 53.91% | 2014 | — |
| GuyanaGUY | 52.74% | 2019 | |
| IraqIRQ | 52.71% | 2021 | |
| VanuatuVUT | 50.19% | 2020 | |
| NauruNRU | 48.88% | 2021 | |
| HaitiHTI | 47.51% | 2003 | — |
| ChadTCD | 46.38% | 2018 | — |
| Sao Tome and PrincipeSTP | 46.21% | 2017 | — |
| NepalNPL | 45.82% | 2017 | |
| MalawiMWI | 45.43% | 2024 | |
| SenegalSEN | 43.66% | 2024 | |
| HondurasHND | 43.55% | 2024 | |
| LesothoLSO | 43.39% | 2024 | |
| ZimbabweZWE | 42.97% | 2024 | |
| MaliMLI | 42.72% | 2023 | |
| Marshall IslandsMHL | 42.02% | 2021 | |
| GuineaGIN | 41.49% | 2019 | |
| LiberiaLBR | 40.85% | 2017 | |
| NicaraguaNIC | 40.07% | 2014 | |
| KiribatiKIR | 39.54% | 2023 | |
| IndiaIND | 39.04% | 2024 | |
| EswatiniSWZ | 39.03% | 2023 | |
| Gambia, TheGMB | 38.84% | 2023 | |
| BotswanaBWA | 38.21% | 2024 | |
| GuatemalaGTM | 35.83% | 2024 | |
| South AfricaZAF | 35.61% | 2024 | |
| TuvaluTUV | 35.54% | 2022 | |
| BelizeBLZ | 34.82% | 2019 | |
| Sierra LeoneSLE | 34.81% | 2018 | |
| Egypt, Arab Rep.EGY | 34.76% | 2024 | |
| JordanJOR | 34.54% | 2023 | |
| NamibiaNAM | 34.34% | 2018 | |
| Iran, Islamic Rep.IRN | 34.07% | 2024 | |
| Congo, Dem. Rep.COD | 33.88% | 2020 | |
| Guinea-BissauGNB | 33.65% | 2019 | |
| Micronesia, Fed. Sts.FSM | 33.62% | 2014 | — |
| SamoaWSM | 32.73% | 2022 | |
| KenyaKEN | 32.67% | 2022 | |
| ZambiaZMB | 32.34% | 2023 | |
| South SudanSSD | 32.28% | 2008 | — |
Source: World Bank (WB WDI)