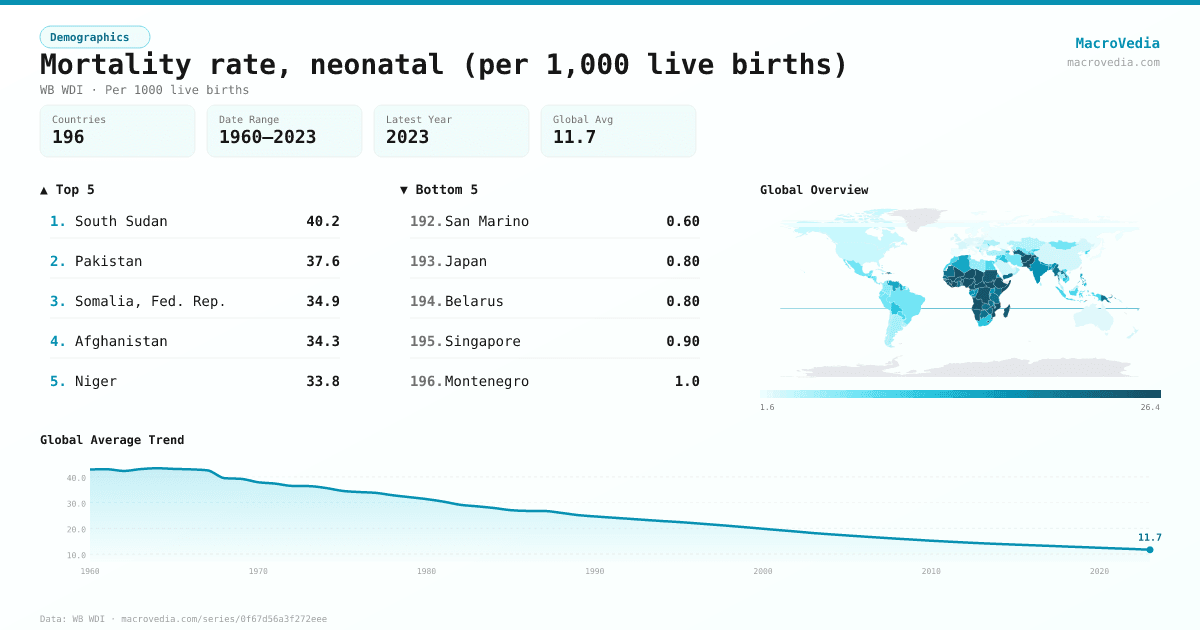
Mortality rate, neonatal (per 1,000 live births)
DemographicsWB WDIwb_wdi:SH.DYN.NMRT•Per 1000 live births•1960 → 2023•196 countries
Series quick facts
High-level context for this country series.
DemographicsWB WDI
Coverage
196
Frequency
yearly
Range
1960 \u2192 2023
Latest
2023
Mortality rate, neonatal (per 1,000 live births) by country
Latest available value per country (as of 2023)
Low \u2192 High
Unit: Per 1000 live births
≤ 2.1
2.1 – 4.17
4.17 – 7.01
7.01 – 10.09
10.09 – 16.94
16.94 – 23.84
> 23.84
No data
Generated by MacroVedia.comSource: World Bank (WB WDI)
Highest 15 countries
Mortality rate, neonatal (per 1,000 live births)
50 countries with data
Generated by MacroVedia.comSource: World Bank (WB WDI)
Distribution across countries
Mortality rate, neonatal (per 1,000 live births)
Countries
50
Median
24.7
Mean
26.2
25th pctl
22.2
75th pctl
29.6
Generated by MacroVedia.comSource: World Bank (WB WDI)
Compare trends
Mortality rate, neonatal (per 1,000 live births)
PakistanLesothoCote d'Ivoire
Generated by MacroVedia.comSource: World Bank (WB WDI)
| Country | Latest | Date | Trend |
|---|---|---|---|
| South SudanSSD | 40.2 Per 1000 live births | 2023 | |
| PakistanPAK | 37.6 Per 1000 live births | 2023 | |
| Somalia, Fed. Rep.SOM | 34.9 Per 1000 live births | 2023 | |
| AfghanistanAFG | 34.3 Per 1000 live births | 2023 | |
| NigerNER | 33.8 Per 1000 live births | 2023 | |
| NigeriaNGA | 33.7 Per 1000 live births | 2023 | |
| Guinea-BissauGNB | 32.7 Per 1000 live births | 2023 | |
| MaliMLI | 32.4 Per 1000 live births | 2023 | |
| ChadTCD | 31.4 Per 1000 live births | 2023 | |
| DominicaDMA | 30.8 Per 1000 live births | 2023 | |
| Central African RepublicCAF | 30.7 Per 1000 live births | 2023 | |
| GuineaGIN | 30.3 Per 1000 live births | 2023 | |
| LiberiaLBR | 29.6 Per 1000 live births | 2023 | |
| Sierra LeoneSLE | 29.3 Per 1000 live births | 2023 | |
| LesothoLSO | 28.7 Per 1000 live births | 2023 | |
| Cote d'IvoireCIV | 28.2 Per 1000 live births | 2023 | |
| DjiboutiDJI | 28.2 Per 1000 live births | 2023 | |
| BeninBEN | 28 Per 1000 live births | 2023 | |
| EthiopiaETH | 27.4 Per 1000 live births | 2023 | |
| Equatorial GuineaGNQ | 27.2 Per 1000 live births | 2023 | |
| AngolaAGO | 25.6 Per 1000 live births | 2023 | |
| MozambiqueMOZ | 25.4 Per 1000 live births | 2023 | |
| Congo, Dem. Rep.COD | 25.3 Per 1000 live births | 2023 | |
| CameroonCMR | 25.2 Per 1000 live births | 2023 | |
| SudanSDN | 24.8 Per 1000 live births | 2023 | |
| Burkina FasoBFA | 24.5 Per 1000 live births | 2023 | |
| EswatiniSWZ | 24.5 Per 1000 live births | 2023 | |
| NamibiaNAM | 24.1 Per 1000 live births | 2023 | |
| MadagascarMDG | 23.8 Per 1000 live births | 2023 | |
| Gambia, TheGMB | 23.7 Per 1000 live births | 2023 | |
| HaitiHTI | 23.3 Per 1000 live births | 2023 | |
| TogoTGO | 23.1 Per 1000 live births | 2023 | |
| TurkmenistanTKM | 22.8 Per 1000 live births | 2023 | |
| ComorosCOM | 22.5 Per 1000 live births | 2023 | |
| KiribatiKIR | 22.4 Per 1000 live births | 2023 | |
| ZimbabweZWE | 22.4 Per 1000 live births | 2023 | |
| SenegalSEN | 22.3 Per 1000 live births | 2023 | |
| Timor-LesteTLS | 22.2 Per 1000 live births | 2023 | |
| ZambiaZMB | 22 Per 1000 live births | 2023 | |
| Dominican RepublicDOM | 21.7 Per 1000 live births | 2023 | |
| KenyaKEN | 21.5 Per 1000 live births | 2023 | |
| MauritaniaMRT | 21.5 Per 1000 live births | 2023 | |
| Yemen, Rep.YEM | 21.4 Per 1000 live births | 2023 | |
| GhanaGHA | 21.2 Per 1000 live births | 2023 | |
| BotswanaBWA | 20.9 Per 1000 live births | 2023 | |
| MyanmarMMR | 20.6 Per 1000 live births | 2023 | |
| TanzaniaTZA | 20.6 Per 1000 live births | 2023 | |
| Papua New GuineaPNG | 20.5 Per 1000 live births | 2023 | |
| Lao PDRLAO | 20 Per 1000 live births | 2023 | |
| BurundiBDI | 19.6 Per 1000 live births | 2023 |
Source: World Bank (WB WDI)