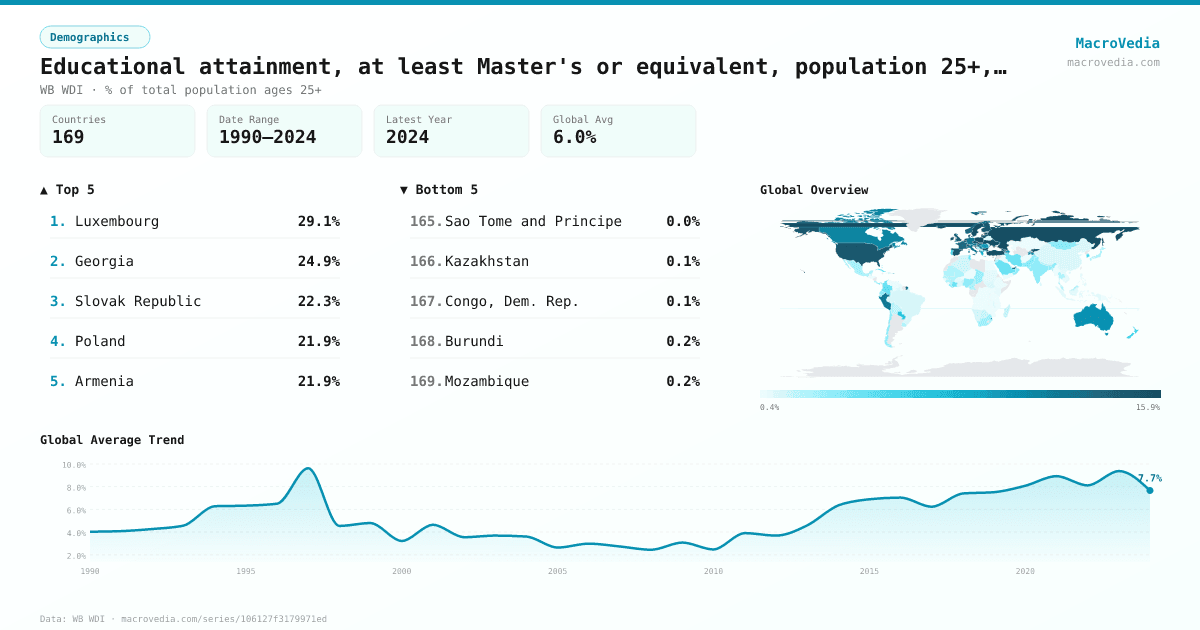
Educational attainment, at least Master's or equivalent, population 25+, total (%) (cumulative)
DemographicsWB WDIwb_wdi:SE.TER.CUAT.MS.ZS•% of total population ages 25+•1990 → 2024•169 countries
Series quick facts
High-level context for this country series.
DemographicsWB WDI
Coverage
169
Frequency
yearly
Range
1990 \u2192 2024
Latest
2024
Educational attainment, at least Master's or equivalent, population 25+, total (%) (cumulative) by country
Latest available value per country (as of 2024)
Low \u2192 High
Unit: %
≤ 0.58%
0.58% – 1.2%
1.2% – 2.13%
2.13% – 3.39%
3.39% – 10.26%
10.26% – 15%
> 15%
No data
Generated by MacroVedia.comSource: World Bank (WB WDI)
Highest 15 countries
Educational attainment, at least Master's or equivalent, population 25+, total (%) (cumulative)
50 countries with data
Generated by MacroVedia.comSource: World Bank (WB WDI)
Distribution across countries
Educational attainment, at least Master's or equivalent, population 25+, total (%) (cumulative)
Countries
50
Median
15%
Mean
15.5%
25th pctl
13%
75th pctl
16.7%
Generated by MacroVedia.comSource: World Bank (WB WDI)
Compare trends
Educational attainment, at least Master's or equivalent, population 25+, total (%) (cumulative)
CanadaUnited StatesAustralia
Generated by MacroVedia.comSource: World Bank (WB WDI)
| Country | Latest | Date | Trend |
|---|---|---|---|
| LuxembourgLUX | 29.14% | 2023 | |
| GeorgiaGEO | 24.94% | 2024 | |
| Slovak RepublicSVK | 22.26% | 2023 | |
| PolandPOL | 21.89% | 2020 | |
| ArmeniaARM | 21.88% | 2023 | |
| EstoniaEST | 21.78% | 2023 | |
| LatviaLVA | 20.17% | 2023 | |
| SwitzerlandCHE | 19.13% | 2024 | |
| BulgariaBGR | 18.87% | 2023 | |
| Russian FederationRUS | 18.85% | 2021 | — |
| CroatiaHRV | 17.04% | 2023 | |
| SwedenSWE | 16.97% | 2023 | |
| IcelandISL | 16.73% | 2023 | |
| CzechiaCZE | 16.63% | 2023 | |
| PortugalPRT | 16.29% | 2023 | |
| UkraineUKR | 16.28% | 2001 | — |
| BelgiumBEL | 16.03% | 2023 | |
| IrelandIRL | 15.98% | 2023 | |
| CyprusCYP | 15.93% | 2023 | |
| TurkiyeTUR | 15.83% | 2023 | |
| LithuaniaLTU | 15.78% | 2023 | |
| Kyrgyz RepublicKGZ | 15.45% | 2009 | — |
| IsraelISR | 15.34% | 2023 | |
| NetherlandsNLD | 15.2% | 2023 | |
| United StatesUSA | 15% | 2024 | |
| FinlandFIN | 14.92% | 2023 | |
| SpainESP | 14.88% | 2023 | |
| United KingdomGBR | 14.37% | 2021 | |
| DenmarkDNK | 14.03% | 2023 | |
| CuracaoCUW | 13.95% | 2020 | — |
| SloveniaSVN | 13.73% | 2023 | |
| NorwayNOR | 13.64% | 2023 | |
| FranceFRA | 13.46% | 2023 | |
| United Arab EmiratesARE | 13.36% | 2024 | |
| LebanonLBN | 13.15% | 2019 | — |
| San MarinoSMR | 13.13% | 2022 | |
| HungaryHUN | 13.06% | 2023 | |
| ItalyITA | 12.98% | 2023 | |
| AustriaAUT | 12.77% | 2021 | |
| AndorraAND | 12.74% | 2022 | |
| GermanyDEU | 12.7% | 2023 | |
| PeruPER | 11.89% | 2018 | |
| SerbiaSRB | 11.78% | 2022 | |
| MaltaMLT | 11.55% | 2023 | |
| AlbaniaALB | 11.38% | 2023 | |
| CanadaCAN | 11.22% | 2023 | |
| TajikistanTJK | 10.95% | 2017 | |
| AzerbaijanAZE | 10.3% | 2023 | — |
| AustraliaAUS | 10.26% | 2024 | |
| EswatiniSWZ | 10.08% | 2023 |
Source: World Bank (WB WDI)