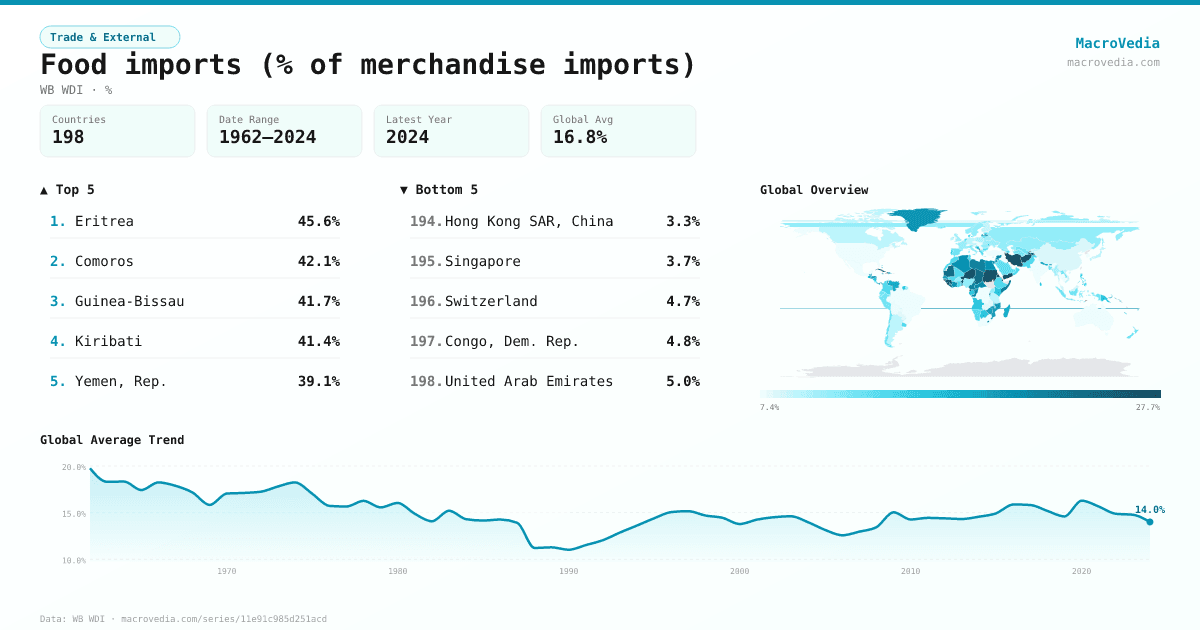
Food imports (% of merchandise imports)
Trade & ExternalWB WDIwb_wdi:TM.VAL.FOOD.ZS.UN•%•1962 → 2024•198 countries
Series quick facts
High-level context for this country series.
Trade & ExternalWB WDI
Coverage
198
Frequency
—
Range
1962 \u2192 2024
Latest
2024
Food imports (% of merchandise imports) by country
Latest available value per country (as of 2024)
Low \u2192 High
Unit: %
≤ 8.54%
8.54% – 11.52%
11.52% – 13.69%
13.69% – 17.34%
17.34% – 21%
21% – 25.91%
> 25.91%
No data
Generated by MacroVedia.comSource: World Bank (WB WDI)
Highest 15 countries
Food imports (% of merchandise imports)
50 countries with data
Generated by MacroVedia.comSource: World Bank (WB WDI)
Distribution across countries
Food imports (% of merchandise imports)
Countries
50
Median
26.5%
Mean
28.4%
25th pctl
23.8%
75th pctl
31.6%
Generated by MacroVedia.comSource: World Bank (WB WDI)
Compare trends
Food imports (% of merchandise imports)
BarbadosCameroonSeychelles
Generated by MacroVedia.comSource: World Bank (WB WDI)
| Country | Latest | Date | Trend |
|---|---|---|---|
| EritreaERI | 45.57% | 2003 | |
| ComorosCOM | 42.07% | 2023 | |
| Guinea-BissauGNB | 41.71% | 2018 | |
| KiribatiKIR | 41.44% | 2021 | |
| Yemen, Rep.YEM | 39.09% | 2019 | |
| DjiboutiDJI | 38.56% | 2023 | |
| NigerNER | 37.89% | 2024 | |
| BeninBEN | 33.27% | 2024 | |
| Cabo VerdeCPV | 32.56% | 2024 | |
| Sierra LeoneSLE | 32.29% | 2018 | |
| Sao Tome and PrincipeSTP | 31.81% | 2023 | |
| Equatorial GuineaGNQ | 31.8% | 1983 | |
| Virgin Islands (U.S.)VIR | 31.64% | 1977 | |
| West Bank and GazaPSE | 30.92% | 2023 | |
| ArubaABW | 30.75% | 2023 | |
| SudanSDN | 29.91% | 2018 | |
| SamoaWSM | 29.63% | 2024 | |
| Iran, Islamic Rep.IRN | 29.46% | 2022 | |
| Timor-LesteTLS | 28.06% | 2023 | |
| Micronesia, Fed. Sts.FSM | 27.76% | 2013 | |
| Antigua and BarbudaATG | 27.67% | 2024 | |
| St. LuciaLCA | 27.64% | 2020 | |
| TongaTON | 27.49% | 2023 | |
| AfghanistanAFG | 26.92% | 2019 | |
| GuineaGIN | 26.58% | 2016 | |
| TajikistanTJK | 26.46% | 2023 | |
| SeychellesSYC | 26.11% | 2024 | |
| HaitiHTI | 26.1% | 1981 | |
| St. Vincent and the GrenadinesVCT | 26% | 2023 | |
| St. Kitts and NevisKNA | 25.38% | 2017 | |
| Turks and Caicos IslandsTCA | 25.34% | 2012 | |
| CubaCUB | 25.21% | 2022 | |
| DominicaDMA | 25.16% | 2023 | |
| VanuatuVUT | 24.96% | 2011 | |
| ChadTCD | 24.27% | 1995 | |
| GrenadaGRD | 24.18% | 2024 | |
| MauritaniaMRT | 23.87% | 2024 | |
| EthiopiaETH | 23.8% | 2022 | |
| MontenegroMNE | 23.6% | 2024 | |
| LiberiaLBR | 23.09% | 2023 | |
| PalauPLW | 22.96% | 2018 | |
| LesothoLSO | 22.95% | 2024 | |
| BarbadosBRB | 22.7% | 2024 | |
| Somalia, Fed. Rep.SOM | 22.44% | 1982 | |
| RwandaRWA | 22.44% | 2022 | |
| Solomon IslandsSLB | 22.19% | 2018 | |
| Gambia, TheGMB | 22.01% | 2024 | |
| CameroonCMR | 21.75% | 2023 | |
| LibyaLBY | 21.6% | 2019 | |
| TuvaluTUV | 21.54% | 2008 |
Source: World Bank (WB WDI)