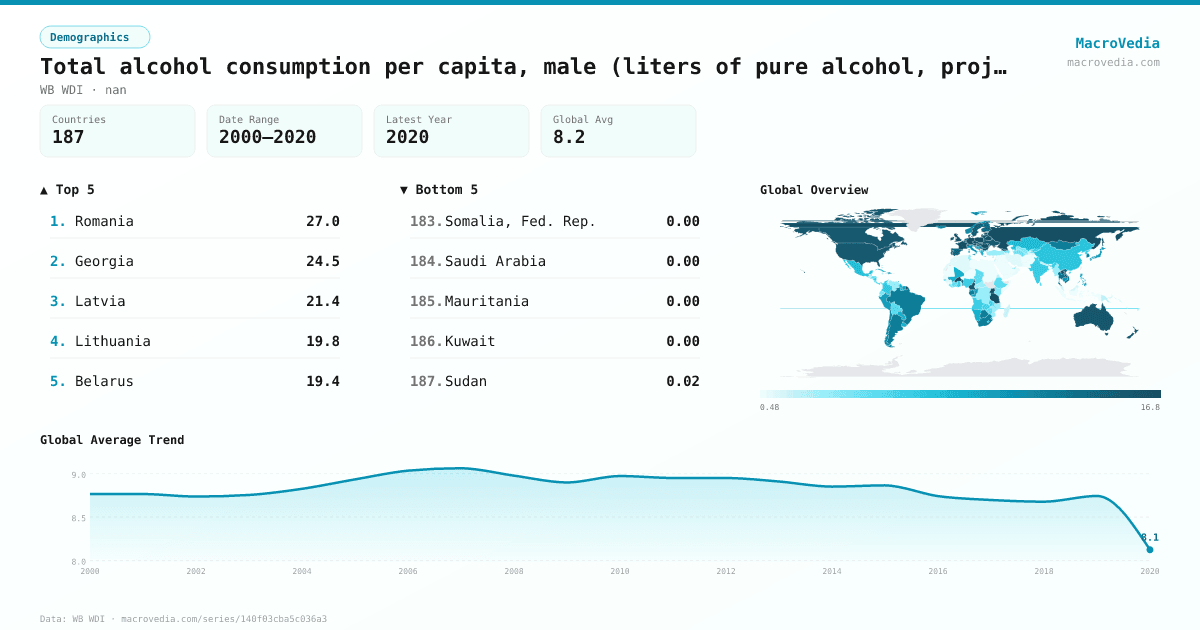
Total alcohol consumption per capita, male (liters of pure alcohol, projected estimates, male 15+ years of age)
DemographicsWB WDIwb_wdi:SH.ALC.PCAP.MA.LI•nan•2000 → 2020•187 countries
Series quick facts
High-level context for this country series.
DemographicsWB WDI
Coverage
187
Frequency
yearly
Range
2000 \u2192 2020
Latest
2020
Total alcohol consumption per capita, male (liters of pure alcohol, projected estimates, male 15+ years of age) by country
Latest available value per country (as of 2020)
Low \u2192 High
Unit: nan
≤ 0.93
0.93 – 3.3
3.3 – 6.01
6.01 – 8.89
8.89 – 12.33
12.33 – 15.67
> 15.67
No data
Generated by MacroVedia.comSource: World Bank (WB WDI)
Highest 15 countries
Total alcohol consumption per capita, male (liters of pure alcohol, projected estimates, male 15+ years of age)
50 countries with data
Generated by MacroVedia.comSource: World Bank (WB WDI)
Distribution across countries
Total alcohol consumption per capita, male (liters of pure alcohol, projected estimates, male 15+ years of age)
Countries
50
Median
16
Mean
16.5
25th pctl
14.8
75th pctl
18.1
Generated by MacroVedia.comSource: World Bank (WB WDI)
Compare trends
Total alcohol consumption per capita, male (liters of pure alcohol, projected estimates, male 15+ years of age)
RomaniaGeorgiaLatvia
Generated by MacroVedia.comSource: World Bank (WB WDI)
| Country | Latest | Date | Trend |
|---|---|---|---|
| RomaniaROU | 27.03 nan | 2020 | |
| GeorgiaGEO | 24.51 nan | 2020 | |
| LatviaLVA | 21.35 nan | 2020 | |
| LithuaniaLTU | 19.82 nan | 2020 | |
| BelarusBLR | 19.44 nan | 2020 | |
| CzechiaCZE | 19.05 nan | 2020 | |
| BulgariaBGR | 19.03 nan | 2020 | |
| Burkina FasoBFA | 19 nan | 2020 | |
| PolandPOL | 18.74 nan | 2020 | |
| GermanyDEU | 18.63 nan | 2020 | |
| TanzaniaTZA | 18.51 nan | 2020 | |
| UgandaUGA | 18.46 nan | 2020 | |
| Russian FederationRUS | 18.14 nan | 2020 | |
| AustriaAUT | 18.09 nan | 2020 | |
| MoldovaMDA | 18.09 nan | 2020 | |
| EstoniaEST | 17.4 nan | 2020 | |
| Lao PDRLAO | 17.08 nan | 2020 | |
| Slovak RepublicSVK | 17.05 nan | 2020 | |
| MontenegroMNE | 16.86 nan | 2019 | |
| United KingdomGBR | 16.83 nan | 2020 | |
| IrelandIRL | 16.6 nan | 2020 | |
| LuxembourgLUX | 16.5 nan | 2020 | |
| FranceFRA | 16.48 nan | 2020 | |
| SloveniaSVN | 16.4 nan | 2020 | |
| HungaryHUN | 16.12 nan | 2020 | |
| AustraliaAUS | 15.92 nan | 2020 | |
| SwitzerlandCHE | 15.68 nan | 2020 | |
| SeychellesSYC | 15.67 nan | 2020 | |
| CanadaCAN | 15.59 nan | 2020 | |
| United StatesUSA | 15.54 nan | 2020 | |
| New ZealandNZL | 15.53 nan | 2020 | |
| UkraineUKR | 15.5 nan | 2020 | |
| CameroonCMR | 15.4 nan | 2020 | |
| St. LuciaLCA | 14.9 nan | 2020 | |
| BelgiumBEL | 14.83 nan | 2020 | |
| SwedenSWE | 14.82 nan | 2020 | |
| AndorraAND | 14.81 nan | 2020 | |
| DenmarkDNK | 14.77 nan | 2020 | |
| SpainESP | 14.52 nan | 2020 | |
| PortugalPRT | 14.4 nan | 2020 | |
| BeninBEN | 14.27 nan | 2020 | |
| FinlandFIN | 14.25 nan | 2020 | |
| BarbadosBRB | 13.64 nan | 2020 | |
| NetherlandsNLD | 13.59 nan | 2020 | |
| ThailandTHA | 13.29 nan | 2020 | |
| Viet NamVNM | 13.18 nan | 2020 | |
| SerbiaSRB | 12.94 nan | 2019 | |
| GabonGAB | 12.73 nan | 2020 | |
| ArgentinaARG | 12.59 nan | 2020 | |
| South AfricaZAF | 12.41 nan | 2020 |
Source: World Bank (WB WDI)