Children in employment, unpaid family workers, male (% of male children in employment, ages 7-
DemographicsWB WDIwb_wdi:SL.FAM.0714.MA.ZS•Percent•1999 → 2016•95 countries
Series quick facts
High-level context for this country series.
DemographicsWB WDI
Coverage
95
Frequency
—
Range
1999 \u2192 2016
Latest
2015
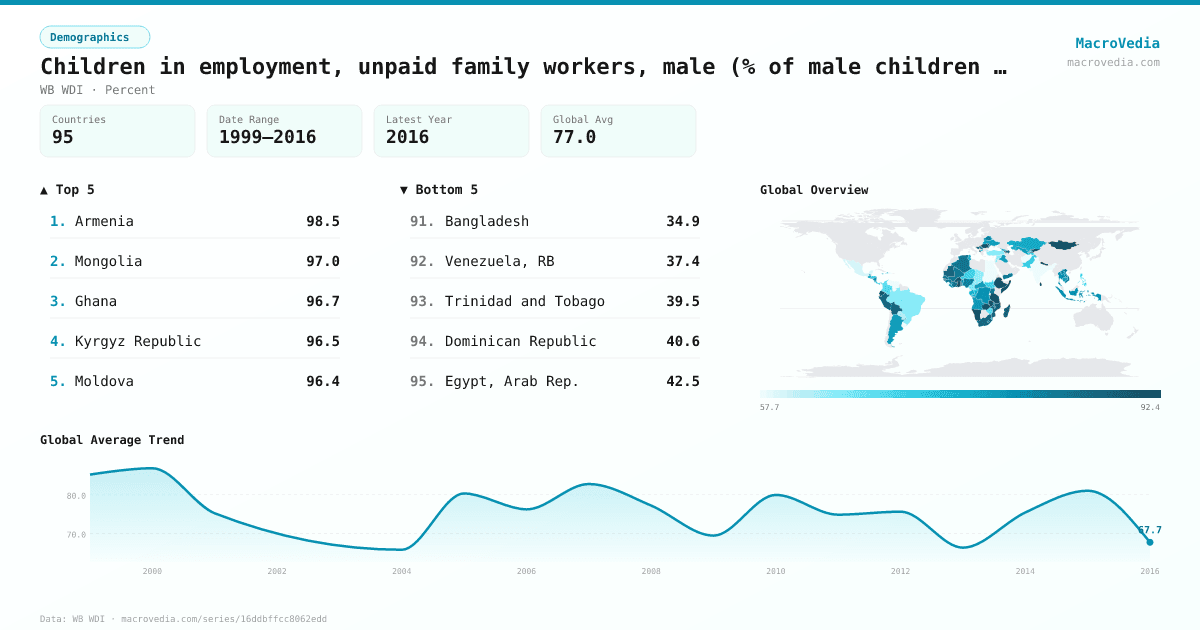
Children in employment, unpaid family workers, male (% of male children in employment, ages 7- by country
Latest available value per country (as of 2015)
Low \u2192 High
Unit: %
≤ 63.76%
63.76% – 72.59%
72.59% – 77.91%
77.91% – 82.05%
82.05% – 85.95%
85.95% – 90.92%
> 90.92%
No data
Generated by MacroVedia.comSource: World Bank (WB WDI)
Highest 15 countries
Children in employment, unpaid family workers, male (% of male children in employment, ages 7-
50 countries with data
Generated by MacroVedia.comSource: World Bank (WB WDI)
Distribution across countries
Children in employment, unpaid family workers, male (% of male children in employment, ages 7-
Countries
50
Median
87%
Mean
87.6%
25th pctl
83.3%
75th pctl
91.3%
Generated by MacroVedia.comSource: World Bank (WB WDI)
Compare trends
Children in employment, unpaid family workers, male (% of male children in employment, ages 7-
TanzaniaBoliviaNicaragua
Generated by MacroVedia.comSource: World Bank (WB WDI)
| Country | Latest | Date | Trend |
|---|---|---|---|
| ArmeniaARM | 98.52% | 2010 | — |
| MongoliaMNG | 96.98% | 2012 | |
| GhanaGHA | 96.7% | 2012 | |
| Kyrgyz RepublicKGZ | 96.5% | 2014 | |
| MoldovaMDA | 96.38% | 2009 | — |
| TanzaniaTZA | 96.3% | 2014 | |
| Somalia, Fed. Rep.SOM | 96.26% | 2006 | — |
| Gambia, TheGMB | 94.66% | 2015 | — |
| NamibiaNAM | 93.6% | 1999 | — |
| ZambiaZMB | 92.68% | 2008 | — |
| NepalNPL | 91.97% | 2008 | |
| AlbaniaALB | 91.59% | 2010 | |
| RomaniaROU | 91.34% | 2000 | — |
| Sri LankaLKA | 91% | 2009 | — |
| EthiopiaETH | 90.82% | 2011 | — |
| Bosnia and HerzegovinaBIH | 90.31% | 2006 | — |
| EcuadorECU | 90.26% | 2015 | |
| TogoTGO | 90.1% | 2010 | — |
| Burkina FasoBFA | 90.03% | 2010 | |
| AzerbaijanAZE | 89.2% | 2005 | — |
| MozambiqueMOZ | 89.2% | 2008 | — |
| MadagascarMDG | 89.09% | 2007 | — |
| BoliviaBOL | 87.95% | 2015 | |
| Guinea-BissauGNB | 87.14% | 2006 | — |
| PeruPER | 87.13% | 2007 | — |
| MauritaniaMRT | 86.93% | 2011 | |
| South AfricaZAF | 86.52% | 1999 | — |
| Egypt, Arab Rep.EGY | 85.86% | 2005 | — |
| BurundiBDI | 85.58% | 2010 | — |
| SenegalSEN | 85.43% | 2011 | — |
| Cote d'IvoireCIV | 85.23% | 2012 | |
| SerbiaSRB | 85.09% | 2005 | — |
| UgandaUGA | 84.9% | 2012 | |
| AlgeriaDZA | 84.65% | 2013 | — |
| MalawiMWI | 83.99% | 2015 | |
| Yemen, Rep.YEM | 83.71% | 2010 | |
| GuineaGIN | 83.64% | 2012 | |
| MaliMLI | 83.31% | 2013 | |
| Viet NamVNM | 82.35% | 2012 | |
| LesothoLSO | 82.26% | 2000 | — |
| Lao PDRLAO | 82.12% | 2010 | |
| NigeriaNGA | 81.88% | 2011 | |
| BelarusBLR | 81.82% | 2012 | |
| IndonesiaIDN | 81.2% | 2010 | — |
| ThailandTHA | 81.01% | 2006 | |
| BeninBEN | 80.39% | 2012 | — |
| NicaraguaNIC | 80.37% | 2012 | |
| LiberiaLBR | 80.03% | 2010 | — |
| Congo, Dem. Rep.COD | 79.5% | 2010 | — |
| AngolaAGO | 78.9% | 2001 | — |
Source: World Bank (WB WDI)