Proportion of women subjected to physical and/or sexual violence in the last 12 months (% of ever-partnered women age…
DemographicsWB WDIwb_wdi:SG.VAW.1549.ZS•% of ever-partnered women and girls ages 15 years and older•2000 → 2017•106 countries
Series quick facts
High-level context for this country series.
DemographicsWB WDI
Coverage
106
Frequency
—
Range
2000 \u2192 2017
Latest
2017
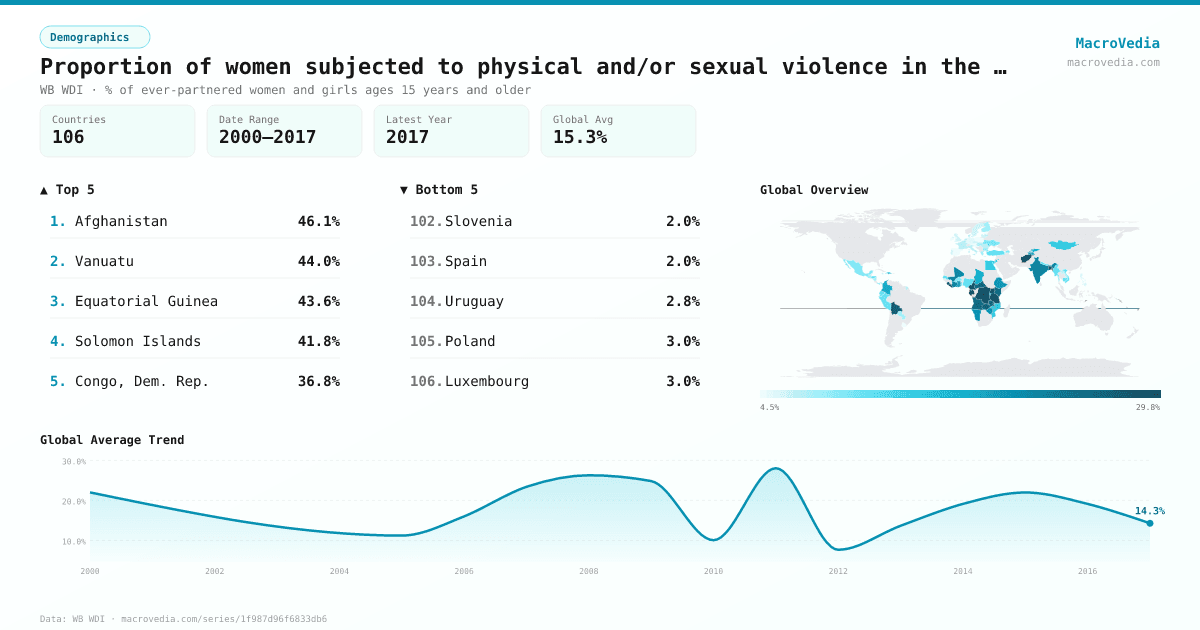
Proportion of women subjected to physical and/or sexual violence in the last 12 months (% of ever-partnered women ages 15- by country
Latest available value per country (as of 2017)
Low \u2192 High
Unit: %
≤ 6%
6% – 7.3%
7.3% – 9.8%
9.8% – 14%
14% – 20.2%
20.2% – 27.9%
> 27.9%
No data
Generated by MacroVedia.comSource: World Bank (WB WDI)
Highest 15 countries
Proportion of women subjected to physical and/or sexual violence in the last 12 months (% of ever-partnered women ages 15-
50 countries with data
Generated by MacroVedia.comSource: World Bank (WB WDI)
Distribution across countries
Proportion of women subjected to physical and/or sexual violence in the last 12 months (% of ever-partnered women ages 15-
Countries
50
Median
23.2%
Mean
24.5%
25th pctl
18.4%
75th pctl
29.6%
Generated by MacroVedia.comSource: World Bank (WB WDI)
Compare trends
Proportion of women subjected to physical and/or sexual violence in the last 12 months (% of ever-partnered women ages 15-
AfghanistanVanuatuEquatorial Guinea
Generated by MacroVedia.comSource: World Bank (WB WDI)
| Country | Latest | Date | Trend |
|---|---|---|---|
| AfghanistanAFG | 46.1% | 2015 | — |
| VanuatuVUT | 44% | 2009 | — |
| Equatorial GuineaGNQ | 43.6% | 2011 | — |
| Solomon IslandsSLB | 41.8% | 2008 | — |
| Congo, Dem. Rep.COD | 36.8% | 2014 | — |
| KiribatiKIR | 36.1% | 2008 | — |
| LiberiaLBR | 35% | 2007 | — |
| Timor-LesteTLS | 34.6% | 2016 | — |
| CameroonCMR | 32.7% | 2014 | — |
| GabonGAB | 31.5% | 2012 | — |
| UgandaUGA | 29.9% | 2016 | — |
| FijiFJI | 29.7% | 2011 | — |
| TanzaniaTZA | 29.6% | 2016 | — |
| BangladeshBGD | 28.8% | 2015 | — |
| Sierra LeoneSLE | 28.7% | 2013 | — |
| BurundiBDI | 27.9% | 2017 | — |
| BoliviaBOL | 27.1% | 2016 | — |
| ZambiaZMB | 26.7% | 2014 | — |
| Central African RepublicCAF | 26.3% | 2006 | — |
| Sao Tome and PrincipeSTP | 26.3% | 2009 | — |
| Micronesia, Fed. Sts.FSM | 26% | 2014 | — |
| AngolaAGO | 25.9% | 2016 | — |
| KenyaKEN | 25.5% | 2014 | — |
| TuvaluTUV | 25% | 2007 | — |
| MalawiMWI | 24.3% | 2016 | — |
| Cote d'IvoireCIV | 22% | 2012 | — |
| IndiaIND | 22% | 2016 | — |
| SamoaWSM | 22% | 2000 | — |
| MaliMLI | 21.5% | 2006 | — |
| RwandaRWA | 20.7% | 2015 | — |
| NamibiaNAM | 20.2% | 2013 | — |
| Marshall IslandsMHL | 20.1% | 2014 | — |
| ZimbabweZWE | 19.9% | 2015 | — |
| EthiopiaETH | 19.8% | 2016 | — |
| GhanaGHA | 19.2% | 2008 | — |
| TajikistanTJK | 19% | 2017 | — |
| TongaTON | 18.9% | 2009 | — |
| ColombiaCOL | 18.4% | 2015 | — |
| ChadTCD | 17.5% | 2015 | — |
| Kyrgyz RepublicKGZ | 17.1% | 2012 | — |
| Dominican RepublicDOM | 16% | 2013 | — |
| MozambiqueMOZ | 15.5% | 2015 | — |
| MongoliaMNG | 14.7% | 2017 | — |
| MoldovaMDA | 14.6% | 2005 | — |
| JordanJOR | 14.1% | 2012 | — |
| Egypt, Arab Rep.EGY | 14% | 2014 | — |
| HaitiHTI | 13.9% | 2017 | — |
| TogoTGO | 12.7% | 2014 | — |
| SenegalSEN | 12.2% | 2017 | — |
| NepalNPL | 11.2% | 2016 | — |
Source: World Bank (WB WDI)