Educational attainment, at least completed short-cycle tertiary, population 25+, total (%) (cumulative)
DemographicsWB WDIwb_wdi:SE.TER.CUAT.ST.ZS•% of total population ages 25+•1970 → 2024•184 countries
Series quick facts
High-level context for this country series.
DemographicsWB WDI
Coverage
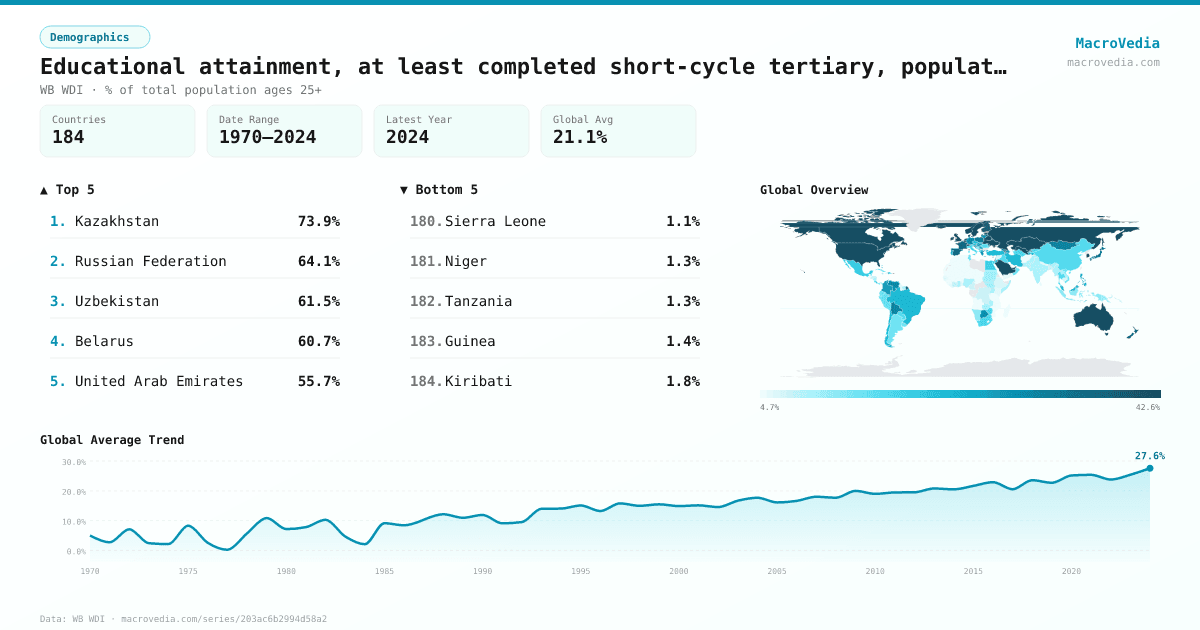
184
Frequency
—
Range
1970 \u2192 2024
Latest
2024
Educational attainment, at least completed short-cycle tertiary, population 25+, total (%) (cumulative) by country
Latest available value per country (as of 2024)
Low \u2192 High
Unit: %
≤ 5.79%
5.79% – 9.65%
9.65% – 15.23%
15.23% – 21.78%
21.78% – 27.84%
27.84% – 38.73%
> 38.73%
No data
Generated by MacroVedia.comSource: World Bank (WB WDI)
Highest 15 countries
Educational attainment, at least completed short-cycle tertiary, population 25+, total (%) (cumulative)
50 countries with data
Generated by MacroVedia.comSource: World Bank (WB WDI)
Distribution across countries
Educational attainment, at least completed short-cycle tertiary, population 25+, total (%) (cumulative)
Countries
50
Median
38.9%
Mean
41.8%
25th pctl
35.4%
75th pctl
47.5%
Generated by MacroVedia.comSource: World Bank (WB WDI)
Compare trends
Educational attainment, at least completed short-cycle tertiary, population 25+, total (%) (cumulative)
SpainGreeceUnited States
Generated by MacroVedia.comSource: World Bank (WB WDI)
| Country | Latest | Date | Trend |
|---|---|---|---|
| KazakhstanKAZ | 73.91% | 2018 | |
| Russian FederationRUS | 64.09% | 2021 | |
| UzbekistanUZB | 61.51% | 2022 | |
| BelarusBLR | 60.69% | 2019 | |
| United Arab EmiratesARE | 55.67% | 2024 | |
| SingaporeSGP | 53.19% | 2024 | |
| IrelandIRL | 51.25% | 2023 | |
| United StatesUSA | 49.83% | 2024 | |
| Korea, Rep.KOR | 49.56% | 2024 | |
| CanadaCAN | 49.3% | 2021 | |
| United KingdomGBR | 48.67% | 2021 | |
| UkraineUKR | 47.79% | 2021 | |
| AustraliaAUS | 47.47% | 2024 | |
| LuxembourgLUX | 46.41% | 2023 | |
| SwedenSWE | 45.22% | 2023 | |
| CyprusCYP | 43.88% | 2023 | |
| ArmeniaARM | 43.32% | 2020 | |
| NorwayNOR | 43.29% | 2023 | |
| Saudi ArabiaSAU | 43.02% | 2024 | |
| SwitzerlandCHE | 41.61% | 2024 | |
| BermudaBMU | 40.81% | 2016 | |
| IcelandISL | 40.1% | 2023 | |
| EstoniaEST | 39.88% | 2023 | |
| BahrainBHR | 39.83% | 2024 | |
| NetherlandsNLD | 38.88% | 2023 | |
| FinlandFIN | 38.86% | 2023 | |
| SeychellesSYC | 38.76% | 2020 | |
| Puerto Rico (US)PRI | 38.58% | 2020 | |
| IsraelISR | 38.3% | 2023 | |
| DenmarkDNK | 38.27% | 2023 | |
| Cayman IslandsCYM | 38.17% | 2015 | |
| BelgiumBEL | 37.94% | 2023 | |
| AndorraAND | 37.63% | 2022 | |
| FranceFRA | 37.21% | 2023 | |
| LebanonLBN | 37.21% | 2018 | |
| New ZealandNZL | 36.64% | 2020 | |
| LatviaLVA | 36.36% | 2023 | |
| SpainESP | 35.41% | 2024 | |
| SloveniaSVN | 34.66% | 2022 | |
| JapanJPN | 34.4% | 2010 | |
| MoldovaMDA | 34.32% | 2022 | |
| GeorgiaGEO | 33.7% | 2024 | |
| PolandPOL | 33.32% | 2024 | |
| MongoliaMNG | 31.16% | 2023 | |
| BoliviaBOL | 30.7% | 2023 | |
| PalauPLW | 30.66% | 2020 | |
| GermanyDEU | 30.25% | 2022 | |
| Venezuela, RBVEN | 30.21% | 2017 | |
| LithuaniaLTU | 29.88% | 2013 | |
| GreeceGRC | 29.62% | 2024 |
Source: World Bank (WB WDI)