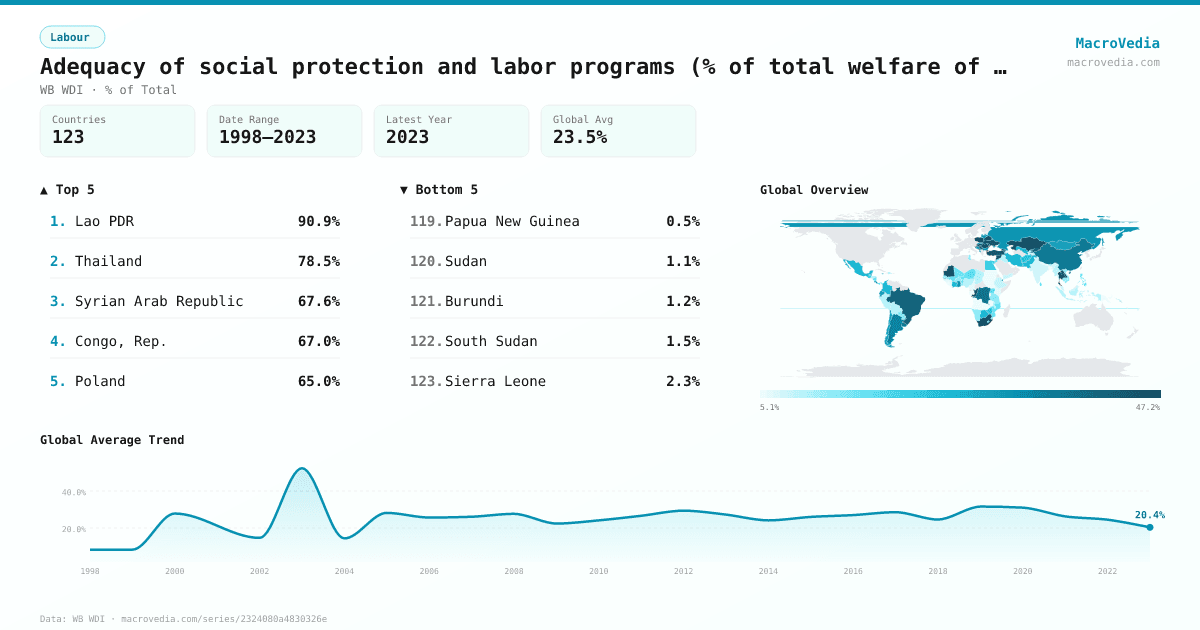
Adequacy of social protection and labor programs (% of total welfare of beneficiary households)
LabourWB WDIwb_wdi:per_allsp.adq_pop_tot•% of Total•1998 → 2023•123 countries
Series quick facts
High-level context for this country series.
LabourWB WDI
Coverage
123
Frequency
—
Range
1998 \u2192 2023
Latest
2022
Adequacy of social protection and labor programs (% of total welfare of beneficiary households) by country
Latest available value per country (as of 2022)
Low \u2192 High
Unit: %
≤ 7.88%
7.88% – 12.57%
12.57% – 18.12%
18.12% – 25.23%
25.23% – 31.49%
31.49% – 42.97%
> 42.97%
No data
Generated by MacroVedia.comSource: World Bank (WB WDI)
Highest 15 countries
Adequacy of social protection and labor programs (% of total welfare of beneficiary households)
50 countries with data
Generated by MacroVedia.comSource: World Bank (WB WDI)
Distribution across countries
Adequacy of social protection and labor programs (% of total welfare of beneficiary households)
Countries
50
Median
37.5%
Mean
42.2%
25th pctl
29%
75th pctl
50.3%
Generated by MacroVedia.comSource: World Bank (WB WDI)
Compare trends
Adequacy of social protection and labor programs (% of total welfare of beneficiary households)
TurkiyeArmeniaUruguay
Generated by MacroVedia.comSource: World Bank (WB WDI)
| Country | Latest | Date | Trend |
|---|---|---|---|
| GhanaGHA | 96.41% | 2012 | — |
| Lao PDRLAO | 90.86% | 2018 | |
| ThailandTHA | 78.45% | 2021 | |
| Syrian Arab RepublicSYR | 67.63% | 2003 | — |
| Congo, Rep.COG | 66.99% | 2005 | — |
| PolandPOL | 64.99% | 2019 | |
| SerbiaSRB | 57.28% | 2022 | |
| RomaniaROU | 56.71% | 2021 | |
| BelarusBLR | 53.01% | 2019 | |
| MoldovaMDA | 50.94% | 2018 | |
| MontenegroMNE | 50.78% | 2014 | |
| HungaryHUN | 50.4% | 2007 | — |
| South AfricaZAF | 50.33% | 2021 | |
| KazakhstanKAZ | 47.65% | 2021 | |
| MauritaniaMRT | 45.34% | 2008 | — |
| UkraineUKR | 44.65% | 2020 | |
| TurkiyeTUR | 44.5% | 2019 | |
| MauritiusMUS | 43.45% | 2017 | |
| GeorgiaGEO | 42.34% | 2021 | |
| Kyrgyz RepublicKGZ | 42.2% | 2020 | |
| CroatiaHRV | 41.83% | 2014 | |
| BrazilBRA | 41.43% | 2022 | |
| Marshall IslandsMHL | 41.03% | 2019 | |
| ArmeniaARM | 40.75% | 2022 | |
| Congo, Dem. Rep.COD | 38.26% | 2012 | |
| ChinaCHN | 36.83% | 2013 | — |
| UruguayURY | 35.23% | 2022 | |
| Costa RicaCRI | 34.66% | 2022 | |
| ArgentinaARG | 34.35% | 2022 | |
| LithuaniaLTU | 33.19% | 2008 | — |
| ZambiaZMB | 32.62% | 2010 | — |
| Bosnia and HerzegovinaBIH | 32.45% | 2015 | |
| LatviaLVA | 32.37% | 2009 | |
| Slovak RepublicSVK | 32.3% | 2009 | — |
| BulgariaBGR | 32.19% | 2007 | — |
| Russian FederationRUS | 31.37% | 2017 | |
| KosovoXKX | 30.15% | 2017 | |
| DjiboutiDJI | 28.95% | 2012 | — |
| MongoliaMNG | 28.92% | 2020 | |
| DominicaDMA | 28.88% | 2002 | — |
| Gambia, TheGMB | 28.86% | 2015 | |
| EcuadorECU | 28.37% | 2022 | |
| ChileCHL | 28.27% | 2022 | |
| AlbaniaALB | 27.99% | 2012 | |
| PalauPLW | 27.99% | 2006 | — |
| Micronesia, Fed. Sts.FSM | 27.9% | 2000 | — |
| JamaicaJAM | 27.69% | 2017 | |
| BhutanBTN | 27.64% | 2012 | |
| UzbekistanUZB | 27.3% | 2018 | — |
| BotswanaBWA | 26.05% | 2015 |
Source: World Bank (WB WDI)