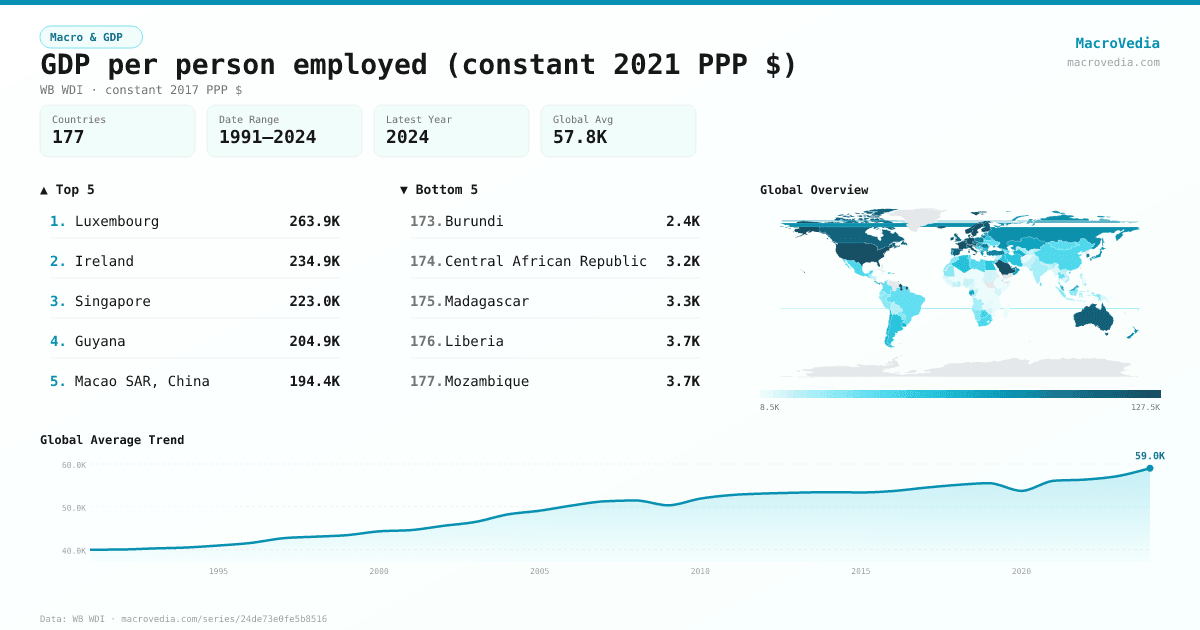
GDP per person employed (constant 2021 PPP $)
Macro & GDPWB WDIwb_wdi:SL.GDP.PCAP.EM.KD•constant 2017 PPP $•1991 → 2024•177 countries
Series quick facts
High-level context for this country series.
Macro & GDPWB WDI
Coverage
177
Frequency
yearly
Range
1991 \u2192 2024
Latest
2024
GDP per person employed (constant 2021 PPP $) by country
Latest available value per country (as of 2024)
Low \u2192 High
Unit: constant 2017 PPP $
≤ 10.46K
10.46K – 20.81K
20.81K – 38.07K
38.07K – 51.52K
51.52K – 77.65K
77.65K – 110.31K
> 110.31K
No data
Generated by MacroVedia.comSource: World Bank (WB WDI)
Highest 15 countries
GDP per person employed (constant 2021 PPP $)
50 countries with data
Generated by MacroVedia.comSource: World Bank (WB WDI)
Distribution across countries
GDP per person employed (constant 2021 PPP $)
Countries
50
Median
111.7K
Mean
123.5K
25th pctl
93.9K
75th pctl
134.1K
Generated by MacroVedia.comSource: World Bank (WB WDI)
Compare trends
GDP per person employed (constant 2021 PPP $)
LuxembourgIrelandSingapore
Generated by MacroVedia.comSource: World Bank (WB WDI)
| Country | Latest | Date | Trend |
|---|---|---|---|
| LuxembourgLUX | 263.86K constant 2017 PPP $ | 2024 | |
| IrelandIRL | 234.91K constant 2017 PPP $ | 2024 | |
| SingaporeSGP | 223.02K constant 2017 PPP $ | 2024 | |
| GuyanaGUY | 204.86K constant 2017 PPP $ | 2024 | |
| Macao SAR, ChinaMAC | 194.42K constant 2017 PPP $ | 2024 | |
| NorwayNOR | 172K constant 2017 PPP $ | 2024 | |
| Brunei DarussalamBRN | 163.27K constant 2017 PPP $ | 2024 | |
| United StatesUSA | 153.54K constant 2017 PPP $ | 2024 | |
| SwitzerlandCHE | 150.73K constant 2017 PPP $ | 2024 | |
| QatarQAT | 149.89K constant 2017 PPP $ | 2024 | |
| BelgiumBEL | 146.63K constant 2017 PPP $ | 2024 | |
| DenmarkDNK | 137.64K constant 2017 PPP $ | 2024 | |
| Hong Kong SAR, ChinaHKG | 134.06K constant 2017 PPP $ | 2024 | |
| Saudi ArabiaSAU | 131.03K constant 2017 PPP $ | 2024 | |
| ItalyITA | 130.39K constant 2017 PPP $ | 2024 | |
| AustriaAUT | 129.65K constant 2017 PPP $ | 2024 | |
| SwedenSWE | 127.94K constant 2017 PPP $ | 2024 | |
| NetherlandsNLD | 127.71K constant 2017 PPP $ | 2024 | |
| FranceFRA | 127.33K constant 2017 PPP $ | 2024 | |
| Puerto Rico (US)PRI | 124.4K constant 2017 PPP $ | 2024 | |
| GermanyDEU | 123.47K constant 2017 PPP $ | 2024 | |
| FinlandFIN | 119.91K constant 2017 PPP $ | 2024 | |
| Virgin Islands (U.S.)VIR | 116.15K constant 2017 PPP $ | 2022 | |
| AustraliaAUS | 114.53K constant 2017 PPP $ | 2024 | |
| IcelandISL | 112.98K constant 2017 PPP $ | 2024 | |
| MaltaMLT | 110.33K constant 2017 PPP $ | 2024 | |
| CanadaCAN | 110.18K constant 2017 PPP $ | 2024 | |
| SpainESP | 108.59K constant 2017 PPP $ | 2024 | |
| United Arab EmiratesARE | 108.2K constant 2017 PPP $ | 2024 | |
| United KingdomGBR | 107.93K constant 2017 PPP $ | 2024 | |
| BahrainBHR | 103.79K constant 2017 PPP $ | 2024 | |
| IsraelISR | 103.28K constant 2017 PPP $ | 2024 | |
| SloveniaSVN | 102.21K constant 2017 PPP $ | 2024 | |
| Korea, Rep.KOR | 98.26K constant 2017 PPP $ | 2024 | |
| CzechiaCZE | 96.01K constant 2017 PPP $ | 2024 | |
| CroatiaHRV | 95.18K constant 2017 PPP $ | 2024 | |
| LithuaniaLTU | 94.08K constant 2017 PPP $ | 2024 | |
| RomaniaROU | 93.93K constant 2017 PPP $ | 2024 | |
| TurkiyeTUR | 93.11K constant 2017 PPP $ | 2024 | |
| PolandPOL | 92.97K constant 2017 PPP $ | 2024 | |
| GreeceGRC | 91.7K constant 2017 PPP $ | 2024 | |
| New ZealandNZL | 89.6K constant 2017 PPP $ | 2024 | |
| PortugalPRT | 88.56K constant 2017 PPP $ | 2024 | |
| Russian FederationRUS | 85.02K constant 2017 PPP $ | 2024 | |
| JapanJPN | 84.35K constant 2017 PPP $ | 2024 | |
| Slovak RepublicSVK | 83.13K constant 2017 PPP $ | 2024 | |
| HungaryHUN | 82.05K constant 2017 PPP $ | 2024 | |
| EstoniaEST | 80.74K constant 2017 PPP $ | 2024 | |
| PanamaPAN | 79.81K constant 2017 PPP $ | 2024 | |
| LatviaLVA | 78.51K constant 2017 PPP $ | 2024 |
Source: World Bank (WB WDI)