Unmet need for contraception (% of married women ages 15-
DemographicsWB WDIwb_wdi:SP.UWT.TFRT•nan•1984 → 2024•152 countries
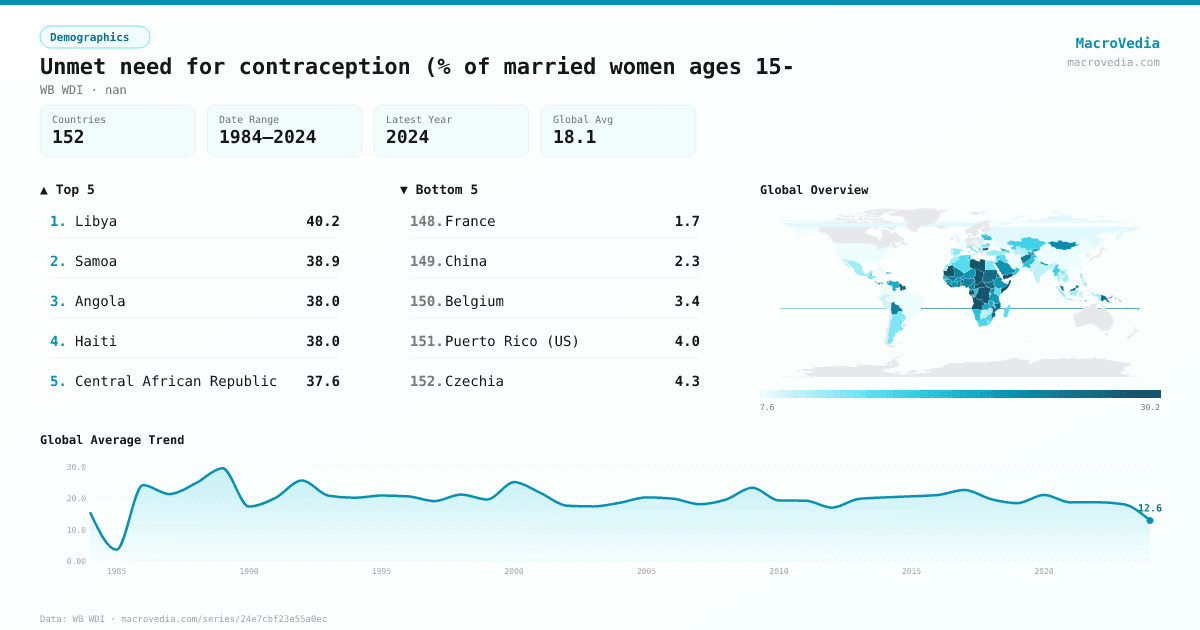
Series quick facts
High-level context for this country series.
DemographicsWB WDI
Coverage
152
Frequency
—
Range
1984 \u2192 2024
Latest
2023
Unmet need for contraception (% of married women ages 15- by country
Latest available value per country (as of 2023)
Low \u2192 High
Unit: %
≤ 8.97%
8.97% – 12.17%
12.17% – 15.38%
15.38% – 20.04%
20.04% – 23.43%
23.43% – 28.55%
> 28.55%
No data
Generated by MacroVedia.comSource: World Bank (WB WDI)
Highest 15 countries
Unmet need for contraception (% of married women ages 15-
50 countries with data
Generated by MacroVedia.comSource: World Bank (WB WDI)
Distribution across countries
Unmet need for contraception (% of married women ages 15-
Countries
50
Median
27%
Mean
29.1%
25th pctl
24.2%
75th pctl
33.4%
Generated by MacroVedia.comSource: World Bank (WB WDI)
Compare trends
Unmet need for contraception (% of married women ages 15-
GhanaNigeriaCote d'Ivoire
Generated by MacroVedia.comSource: World Bank (WB WDI)
| Country | Latest | Date | Trend |
|---|---|---|---|
| OmanOMN | 55.9% | 2008 | — |
| LibyaLBY | 40.2% | 2014 | |
| SamoaWSM | 38.9% | 2020 | |
| AngolaAGO | 38% | 2016 | — |
| HaitiHTI | 38% | 2017 | |
| Central African RepublicCAF | 37.6% | 2019 | |
| ComorosCOM | 36.85% | 2022 | |
| Somalia, Fed. Rep.SOM | 36.6% | 2019 | — |
| Solomon IslandsSLB | 34.7% | 2015 | |
| TogoTGO | 34% | 2017 | |
| Equatorial GuineaGNQ | 33.8% | 2011 | — |
| GabonGAB | 33.4% | 2021 | |
| LiberiaLBR | 33.4% | 2020 | |
| MaldivesMDV | 31.4% | 2017 | |
| MauritaniaMRT | 31.1% | 2021 | |
| GuyanaGUY | 30.5% | 2020 | |
| ChadTCD | 30.2% | 2019 | |
| BeninBEN | 29.9% | 2022 | |
| BurundiBDI | 29.7% | 2017 | |
| BulgariaBGR | 29.7% | 1998 | — |
| Congo, Dem. Rep.COD | 28.75% | 2018 | |
| Yemen, Rep.YEM | 28.7% | 2013 | |
| SurinameSUR | 28.43% | 2018 | |
| EritreaERI | 27.4% | 2010 | |
| Sao Tome and PrincipeSTP | 27.08% | 2019 | |
| BotswanaBWA | 26.9% | 1988 | — |
| MalaysiaMYS | 26.7% | 2022 | — |
| MozambiqueMOZ | 26.6% | 2023 | |
| SudanSDN | 26.58% | 2014 | |
| South SudanSSD | 26.3% | 2010 | — |
| TuvaluTUV | 26.15% | 2020 | |
| Papua New GuineaPNG | 25.9% | 2018 | |
| Timor-LesteTLS | 25.3% | 2016 | |
| FijiFJI | 25.26% | 2021 | — |
| Sierra LeoneSLE | 24.8% | 2019 | |
| AfghanistanAFG | 24.5% | 2015 | — |
| Gambia, TheGMB | 24.2% | 2020 | |
| PanamaPAN | 24.2% | 2015 | |
| VanuatuVUT | 24.2% | 2013 | — |
| MaliMLI | 23.9% | 2018 | |
| NigeriaNGA | 23.85% | 2021 | |
| GeorgiaGEO | 23.7% | 2018 | |
| NauruNRU | 23.5% | 2007 | — |
| Trinidad and TobagoTTO | 23.43% | 2022 | |
| GhanaGHA | 23.4% | 2022 | |
| BoliviaBOL | 23.2% | 2016 | |
| CameroonCMR | 23% | 2018 | |
| TajikistanTJK | 22.7% | 2017 | |
| MongoliaMNG | 22.57% | 2018 | |
| Cote d'IvoireCIV | 22.36% | 2022 |
Source: World Bank (WB WDI)