Management practices index
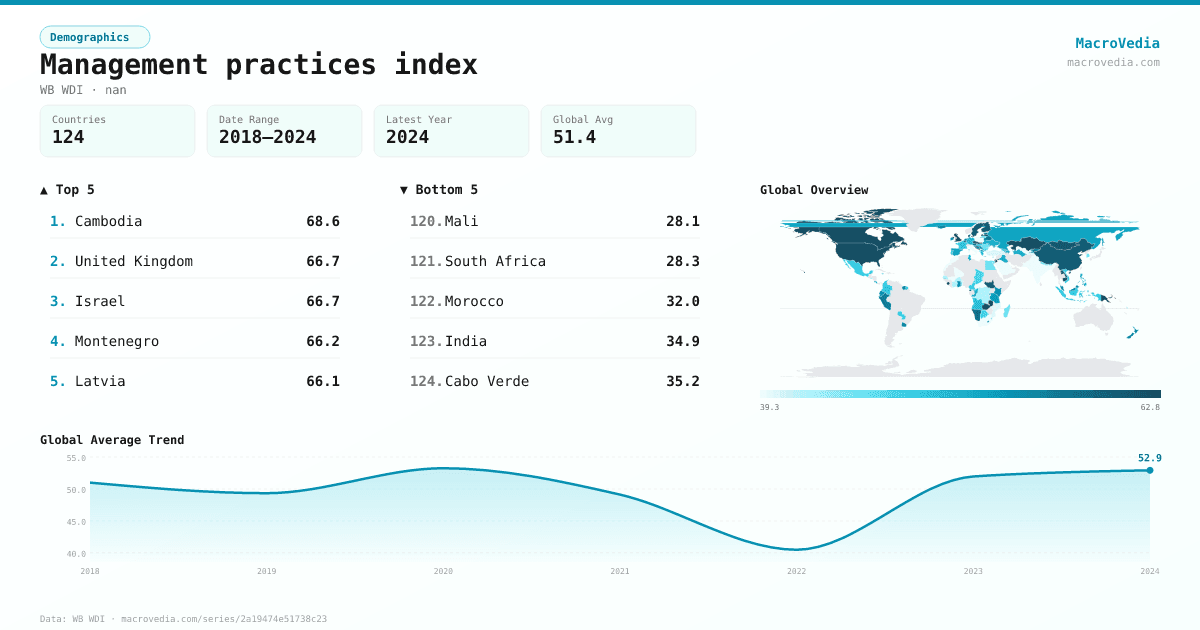
DemographicsWB WDIwb_wdi:IC.MNG.IND•nan•2018 → 2024•124 countries
Series quick facts
High-level context for this country series.
DemographicsWB WDI
Coverage
124
Frequency
—
Range
2018 \u2192 2024
Latest
2024
Management practices index by country
Latest available value per country (as of 2024)
Low \u2192 High
Unit: Index
≤ 41.08
41.08 – 47.1
47.1 – 50.1
50.1 – 53.25
53.25 – 56.58
56.58 – 61.09
> 61.09
No data
Generated by MacroVedia.comSource: World Bank (WB WDI)
Highest 15 countries
Management practices index
50 countries with data
Generated by MacroVedia.comSource: World Bank (WB WDI)
Distribution across countries
Management practices index
Countries
50
Median
59.4
Mean
59.8
25th pctl
56.1
75th pctl
62.8
Generated by MacroVedia.comSource: World Bank (WB WDI)
Compare trends
Management practices index
MontenegroLatviaMalta
Generated by MacroVedia.comSource: World Bank (WB WDI)
| Country | Latest | Date | Trend |
|---|---|---|---|
| CambodiaKHM | 68.6 Index | 2023 | — |
| United KingdomGBR | 66.73 Index | 2024 | — |
| IsraelISR | 66.69 Index | 2024 | — |
| MontenegroMNE | 66.25 Index | 2023 | |
| LatviaLVA | 66.08 Index | 2024 | |
| MaltaMLT | 65.78 Index | 2024 | |
| JordanJOR | 65.23 Index | 2024 | |
| KazakhstanKAZ | 65.16 Index | 2024 | |
| United StatesUSA | 64.33 Index | 2024 | — |
| SamoaWSM | 63.72 Index | 2023 | — |
| Sierra LeoneSLE | 63.48 Index | 2023 | — |
| Papua New GuineaPNG | 63.44 Index | 2024 | — |
| CanadaCAN | 62.77 Index | 2024 | — |
| CroatiaHRV | 62.7 Index | 2023 | |
| ZambiaZMB | 62.48 Index | 2019 | — |
| MongoliaMNG | 61.36 Index | 2019 | — |
| Slovak RepublicSVK | 61.27 Index | 2023 | |
| Lao PDRLAO | 61.11 Index | 2024 | |
| CzechiaCZE | 61.08 Index | 2024 | |
| FinlandFIN | 60.96 Index | 2020 | — |
| BahrainBHR | 60.51 Index | 2024 | — |
| SwedenSWE | 60.49 Index | 2024 | |
| ChinaCHN | 60.43 Index | 2024 | — |
| South SudanSSD | 60.38 Index | 2024 | — |
| LuxembourgLUX | 59.95 Index | 2020 | — |
| DenmarkDNK | 58.89 Index | 2020 | — |
| Equatorial GuineaGNQ | 58.49 Index | 2024 | — |
| MauritiusMUS | 58.47 Index | 2023 | — |
| NamibiaNAM | 58.25 Index | 2024 | — |
| BelgiumBEL | 57.94 Index | 2024 | |
| AustriaAUT | 57.83 Index | 2021 | — |
| BarbadosBRB | 57.75 Index | 2023 | — |
| Bosnia and HerzegovinaBIH | 56.75 Index | 2023 | |
| EstoniaEST | 56.75 Index | 2023 | |
| BelarusBLR | 56.72 Index | 2018 | — |
| Kyrgyz RepublicKGZ | 56.61 Index | 2023 | |
| PeruPER | 56.41 Index | 2023 | — |
| NetherlandsNLD | 56.13 Index | 2020 | — |
| IcelandISL | 56.12 Index | 2024 | — |
| SeychellesSYC | 55.87 Index | 2023 | — |
| New ZealandNZL | 55.43 Index | 2023 | — |
| SurinameSUR | 55.28 Index | 2018 | — |
| UruguayURY | 55.23 Index | 2024 | — |
| SloveniaSVN | 55.2 Index | 2024 | |
| MalaysiaMYS | 54.95 Index | 2024 | |
| SerbiaSRB | 54.69 Index | 2024 | |
| IrelandIRL | 54.61 Index | 2024 | |
| EcuadorECU | 54.5 Index | 2024 | — |
| KenyaKEN | 54.42 Index | 2018 | — |
| GhanaGHA | 53.89 Index | 2023 | — |
Source: World Bank (WB WDI)