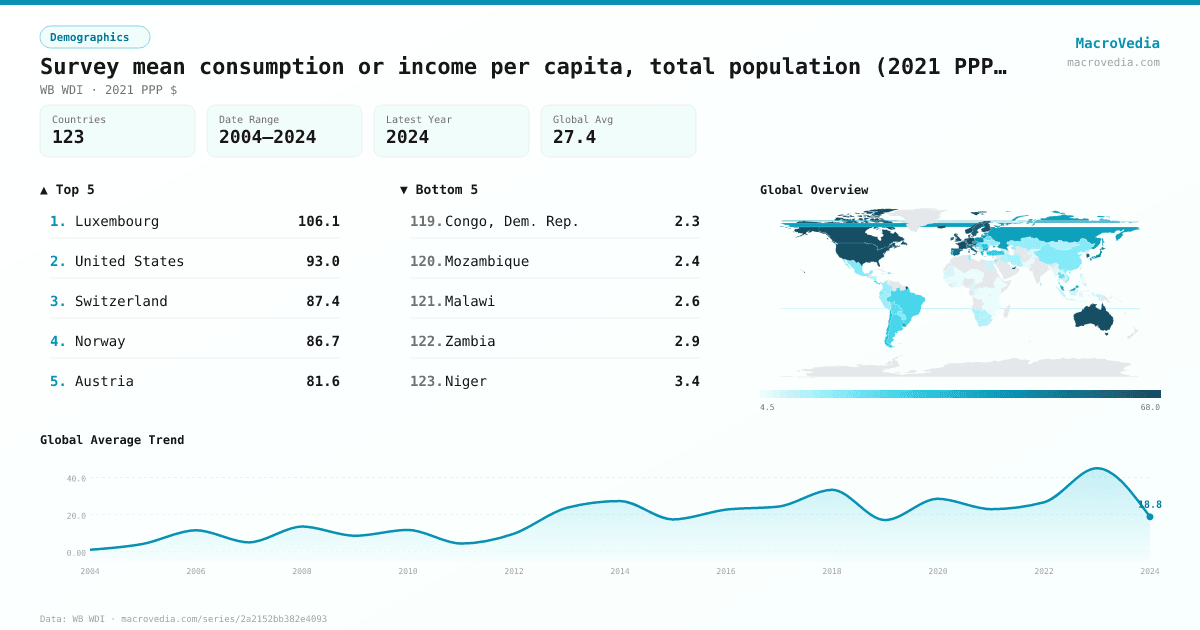
Survey mean consumption or income per capita, total population (2021 PPP $ per day)
DemographicsWB WDIwb_wdi:SI.SPR.PCAP•2021 PPP $•2004 → 2024•123 countries
Series quick facts
High-level context for this country series.
DemographicsWB WDI
Coverage
123
Frequency
—
Range
2004 \u2192 2024
Latest
2024
Survey mean consumption or income per capita, total population (2021 PPP $ per day) by country
Latest available value per country (as of 2024)
Low \u2192 High
Unit: 2021 PPP $
≤ 5.16
5.16 – 9
9 – 14.06
14.06 – 20.5
20.5 – 39.45
39.45 – 63.92
> 63.92
No data
Generated by MacroVedia.comSource: World Bank (WB WDI)
Highest 15 countries
Survey mean consumption or income per capita, total population (2021 PPP $ per day)
50 countries with data
Generated by MacroVedia.comSource: World Bank (WB WDI)
Distribution across countries
Survey mean consumption or income per capita, total population (2021 PPP $ per day)
Countries
50
Median
47.3
Mean
52.6
25th pctl
34.2
75th pctl
68.3
Generated by MacroVedia.comSource: World Bank (WB WDI)
Compare trends
Survey mean consumption or income per capita, total population (2021 PPP $ per day)
LuxembourgUnited StatesSwitzerland
Generated by MacroVedia.comSource: World Bank (WB WDI)
| Country | Latest | Date | Trend |
|---|---|---|---|
| LuxembourgLUX | 106.1 2021 PPP $ | 2023 | |
| United StatesUSA | 92.95 2021 PPP $ | 2023 | |
| SwitzerlandCHE | 87.39 2021 PPP $ | 2022 | |
| NorwayNOR | 86.74 2021 PPP $ | 2023 | |
| AustriaAUT | 81.63 2021 PPP $ | 2023 | |
| GermanyDEU | 79.63 2021 PPP $ | 2020 | |
| United Arab EmiratesARE | 78.78 2021 PPP $ | 2018 | |
| CanadaCAN | 77.73 2021 PPP $ | 2021 | |
| NetherlandsNLD | 75.5 2021 PPP $ | 2021 | |
| DenmarkDNK | 72.67 2021 PPP $ | 2023 | |
| AustraliaAUS | 70.3 2021 PPP $ | 2018 | |
| BelgiumBEL | 69.92 2021 PPP $ | 2023 | |
| IcelandISL | 68.33 2021 PPP $ | 2019 | |
| FranceFRA | 66.8 2021 PPP $ | 2023 | |
| MaltaMLT | 65.45 2021 PPP $ | 2022 | |
| FinlandFIN | 64.46 2021 PPP $ | 2023 | |
| Korea, Rep.KOR | 64.39 2021 PPP $ | 2021 | |
| United KingdomGBR | 64.32 2021 PPP $ | 2021 | |
| CyprusCYP | 63.38 2021 PPP $ | 2023 | |
| SwedenSWE | 62.83 2021 PPP $ | 2023 | |
| IrelandIRL | 59.16 2021 PPP $ | 2023 | |
| ItalyITA | 57.51 2021 PPP $ | 2023 | |
| SpainESP | 54.85 2021 PPP $ | 2023 | |
| SloveniaSVN | 54.71 2021 PPP $ | 2023 | |
| JapanJPN | 48.11 2021 PPP $ | 2020 | |
| LithuaniaLTU | 46.53 2021 PPP $ | 2023 | |
| PolandPOL | 44.05 2021 PPP $ | 2023 | |
| EstoniaEST | 43.8 2021 PPP $ | 2023 | |
| CzechiaCZE | 43.35 2021 PPP $ | 2023 | |
| IsraelISR | 42.78 2021 PPP $ | 2021 | |
| CroatiaHRV | 41.35 2021 PPP $ | 2023 | |
| Russian FederationRUS | 41.11 2021 PPP $ | 2023 | |
| PortugalPRT | 41.07 2021 PPP $ | 2023 | |
| LatviaLVA | 40.02 2021 PPP $ | 2023 | |
| MalaysiaMYS | 39.7 2021 PPP $ | 2021 | |
| BulgariaBGR | 39.41 2021 PPP $ | 2023 | |
| UruguayURY | 35.06 2021 PPP $ | 2019 | |
| GreeceGRC | 34.24 2021 PPP $ | 2023 | |
| ChileCHL | 32.77 2021 PPP $ | 2022 | |
| RomaniaROU | 32.66 2021 PPP $ | 2023 | |
| Costa RicaCRI | 30.73 2021 PPP $ | 2024 | |
| TurkiyeTUR | 28.94 2021 PPP $ | 2022 | |
| PanamaPAN | 28.7 2021 PPP $ | 2024 | |
| ArgentinaARG | 25.94 2021 PPP $ | 2024 | |
| BrazilBRA | 25.53 2021 PPP $ | 2023 | |
| Slovak RepublicSVK | 25.45 2021 PPP $ | 2023 | |
| HungaryHUN | 24.82 2021 PPP $ | 2017 | |
| SeychellesSYC | 23.97 2021 PPP $ | 2018 | |
| BoliviaBOL | 22.93 2021 PPP $ | 2023 | |
| Dominican RepublicDOM | 22.73 2021 PPP $ | 2024 |
Source: World Bank (WB WDI)