Women who were first married by age 18 (% of women ages 20-
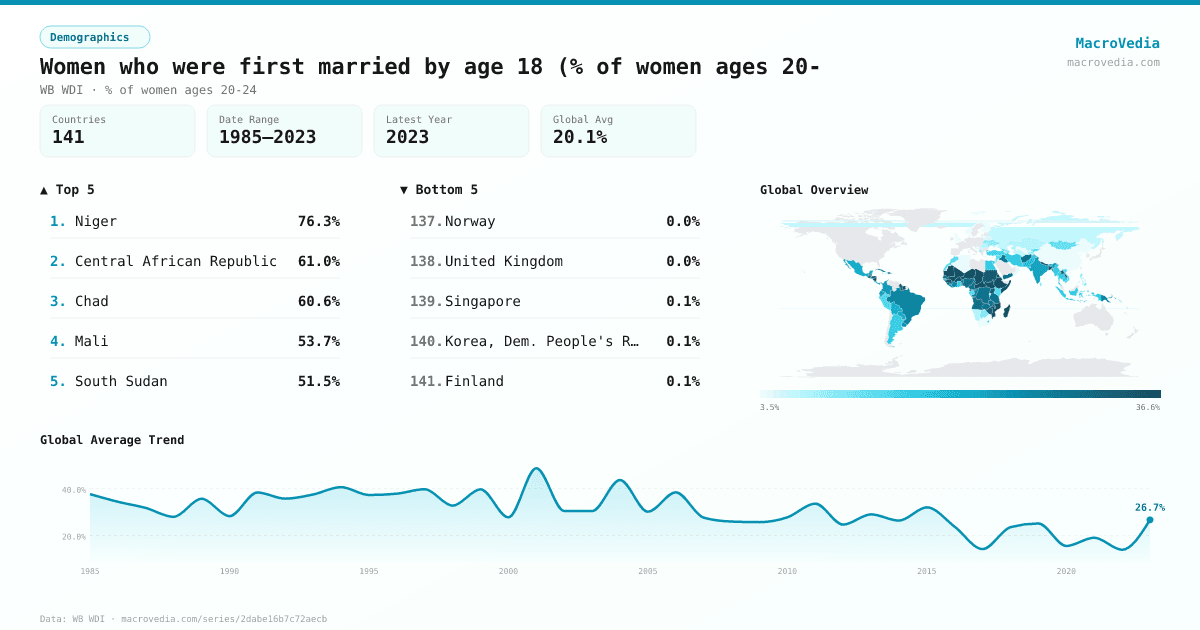
DemographicsWB WDIwb_wdi:SP.M18.2024.FE.ZS•% of women ages 20-24•1985 → 2023•141 countries
Series quick facts
High-level context for this country series.
DemographicsWB WDI
Coverage
141
Frequency
—
Range
1985 \u2192 2023
Latest
2023
Women who were first married by age 18 (% of women ages 20- by country
Latest available value per country (as of 2023)
Low \u2192 High
Unit: %
≤ 5.8%
5.8% – 11%
11% – 16.1%
16.1% – 23.1%
23.1% – 29%
29% – 34.2%
> 34.2%
No data
Generated by MacroVedia.comSource: World Bank (WB WDI)
Highest 15 countries
Women who were first married by age 18 (% of women ages 20-
50 countries with data
Generated by MacroVedia.comSource: World Bank (WB WDI)
Distribution across countries
Women who were first married by age 18 (% of women ages 20-
Countries
50
Median
33.1%
Mean
36%
25th pctl
29.2%
75th pctl
38.2%
Generated by MacroVedia.comSource: World Bank (WB WDI)
Compare trends
Women who were first married by age 18 (% of women ages 20-
SenegalTanzaniaBangladesh
Generated by MacroVedia.comSource: World Bank (WB WDI)
| Country | Latest | Date | Trend |
|---|---|---|---|
| NigerNER | 76.3% | 2012 | |
| Central African RepublicCAF | 61% | 2019 | |
| ChadTCD | 60.6% | 2019 | |
| MaliMLI | 53.7% | 2018 | |
| South SudanSSD | 51.5% | 2010 | — |
| BangladeshBGD | 51.4% | 2019 | |
| MozambiqueMOZ | 48.4% | 2023 | |
| GuineaGIN | 46.5% | 2018 | |
| Somalia, Fed. Rep.SOM | 45.3% | 2006 | — |
| EritreaERI | 40.7% | 2010 | |
| EthiopiaETH | 40.3% | 2016 | |
| MadagascarMDG | 38.8% | 2021 | |
| Burkina FasoBFA | 38.2% | 2021 | |
| MalawiMWI | 37.7% | 2020 | |
| El SalvadorSLV | 37.7% | 1985 | — |
| MauritaniaMRT | 36.6% | 2021 | |
| SurinameSUR | 36% | 2018 | — |
| NicaraguaNIC | 35.2% | 2012 | |
| NepalNPL | 34.9% | 2022 | |
| Trinidad and TobagoTTO | 34.4% | 1987 | — |
| SudanSDN | 34.2% | 2014 | |
| HondurasHND | 34% | 2019 | |
| UgandaUGA | 34% | 2016 | |
| ZimbabweZWE | 33.7% | 2019 | |
| BelizeBLZ | 33.5% | 2016 | — |
| Lao PDRLAO | 32.7% | 2017 | — |
| GuyanaGUY | 32.3% | 2020 | |
| Dominican RepublicDOM | 31.5% | 2019 | |
| SenegalSEN | 30.5% | 2019 | |
| AngolaAGO | 30.3% | 2016 | — |
| NigeriaNGA | 30.3% | 2021 | |
| CameroonCMR | 29.8% | 2018 | |
| Sierra LeoneSLE | 29.6% | 2019 | |
| Yemen, Rep.YEM | 29.6% | 2023 | |
| Equatorial GuineaGNQ | 29.5% | 2011 | — |
| GuatemalaGTM | 29.5% | 2015 | |
| CubaCUB | 29.4% | 2019 | — |
| BarbadosBRB | 29.2% | 2012 | — |
| Congo, Dem. Rep.COD | 29.1% | 2018 | |
| TanzaniaTZA | 29.1% | 2022 | |
| ZambiaZMB | 29% | 2018 | |
| AfghanistanAFG | 28.7% | 2023 | |
| Sao Tome and PrincipeSTP | 28% | 2019 | |
| IraqIRQ | 27.9% | 2018 | — |
| BeninBEN | 27.5% | 2022 | |
| Congo, Rep.COG | 27.3% | 2015 | |
| Papua New GuineaPNG | 27.3% | 2018 | — |
| NauruNRU | 26.8% | 2007 | — |
| PanamaPAN | 26.4% | 2013 | — |
| Marshall IslandsMHL | 26.3% | 2007 | — |
Source: World Bank (WB WDI)