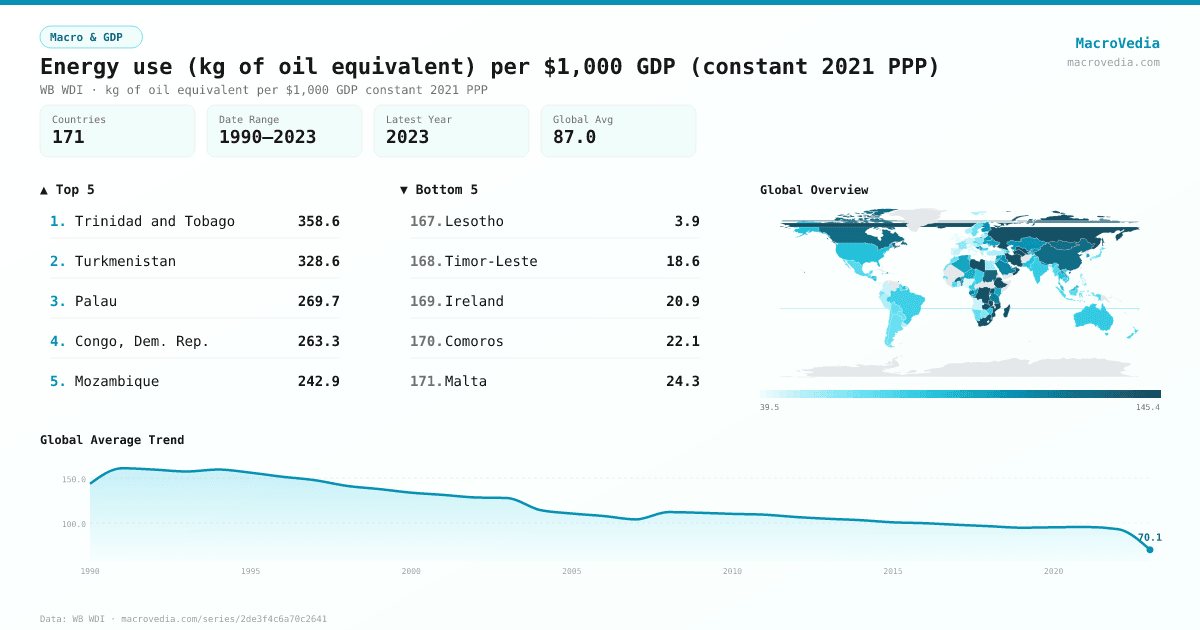
Energy use (kg of oil equivalent) per $1,000 GDP (constant 2021 PPP)
Macro & GDPWB WDIwb_wdi:EG.USE.COMM.GD.PP.KD•kg of oil equivalent per $1,000 GDP constant 2021 PPP•1990 → 2023•171 countries
Series quick facts
High-level context for this country series.
Macro & GDPWB WDI
Coverage
171
Frequency
yearly
Range
1990 \u2192 2023
Latest
2023
Spotlight
Trinidad and Tobago
TTO
358.5748 kg of oil equivalent per $1,000 GDP constant 2021 PPP
2022
Turkmenistan
TKM
328.6089 kg of oil equivalent per $1,000 GDP constant 2021 PPP
2022
Palau
PLW
269.6955 kg of oil equivalent per $1,000 GDP constant 2021 PPP
1990
—
Congo, Dem. Rep.
COD
263.3496 kg of oil equivalent per $1,000 GDP constant 2021 PPP
2022
Mozambique
MOZ
242.8699 kg of oil equivalent per $1,000 GDP constant 2021 PPP
2022
Iceland
ISL
230.2711 kg of oil equivalent per $1,000 GDP constant 2021 PPP
2023
Energy use (kg of oil equivalent) per $1,000 GDP (constant 2021 PPP) by country
Latest available value per country (as of 2023)
Low \u2192 High
Unit: kg of oil equivalent per $1,000 GDP constant 2021 PPP
≤ 43.82
43.82 – 53.55
53.55 – 67.16
67.16 – 78.89
78.89 – 98.95
98.95 – 128.55
> 128.55
No data
Generated by MacroVedia.comSource: World Bank (WB WDI)
Highest 15 countries
Energy use (kg of oil equivalent) per $1,000 GDP (constant 2021 PPP)
50 countries with data
Generated by MacroVedia.comSource: World Bank (WB WDI)
Distribution across countries
Energy use (kg of oil equivalent) per $1,000 GDP (constant 2021 PPP)
Countries
50
Median
128.2
Mean
152.4
25th pctl
107.9
75th pctl
177.7
Generated by MacroVedia.comSource: World Bank (WB WDI)
Compare trends
Energy use (kg of oil equivalent) per $1,000 GDP (constant 2021 PPP)
IcelandSouth AfricaCanada
Generated by MacroVedia.comSource: World Bank (WB WDI)
| Country | Latest | Date | Trend |
|---|---|---|---|
| Trinidad and TobagoTTO | 358.57 kg of oil equivalent per $1,000 GDP constant 2021 PPP | 2022 | |
| TurkmenistanTKM | 328.61 kg of oil equivalent per $1,000 GDP constant 2021 PPP | 2022 | |
| PalauPLW | 269.7 kg of oil equivalent per $1,000 GDP constant 2021 PPP | 1990 | — |
| Congo, Dem. Rep.COD | 263.35 kg of oil equivalent per $1,000 GDP constant 2021 PPP | 2022 | |
| MozambiqueMOZ | 242.87 kg of oil equivalent per $1,000 GDP constant 2021 PPP | 2022 | |
| IcelandISL | 230.27 kg of oil equivalent per $1,000 GDP constant 2021 PPP | 2023 | |
| ZambiaZMB | 223.33 kg of oil equivalent per $1,000 GDP constant 2021 PPP | 2022 | |
| LibyaLBY | 221.76 kg of oil equivalent per $1,000 GDP constant 2021 PPP | 2022 | |
| CuracaoCUW | 211.33 kg of oil equivalent per $1,000 GDP constant 2021 PPP | 2022 | |
| Iran, Islamic Rep.IRN | 199.42 kg of oil equivalent per $1,000 GDP constant 2021 PPP | 2022 | |
| MadagascarMDG | 192.59 kg of oil equivalent per $1,000 GDP constant 2021 PPP | 2022 | |
| BahrainBHR | 185.88 kg of oil equivalent per $1,000 GDP constant 2021 PPP | 2022 | |
| KuwaitKWT | 177.69 kg of oil equivalent per $1,000 GDP constant 2021 PPP | 2022 | |
| UgandaUGA | 177.19 kg of oil equivalent per $1,000 GDP constant 2021 PPP | 2022 | |
| TogoTGO | 155.27 kg of oil equivalent per $1,000 GDP constant 2021 PPP | 2022 | |
| OmanOMN | 147.49 kg of oil equivalent per $1,000 GDP constant 2021 PPP | 2022 | |
| Marshall IslandsMHL | 145.64 kg of oil equivalent per $1,000 GDP constant 2021 PPP | 2007 | |
| QatarQAT | 145.4 kg of oil equivalent per $1,000 GDP constant 2021 PPP | 2022 | |
| Russian FederationRUS | 144.1 kg of oil equivalent per $1,000 GDP constant 2021 PPP | 2022 | |
| UzbekistanUZB | 143.82 kg of oil equivalent per $1,000 GDP constant 2021 PPP | 2022 | |
| EthiopiaETH | 142.31 kg of oil equivalent per $1,000 GDP constant 2021 PPP | 2022 | |
| South AfricaZAF | 141.54 kg of oil equivalent per $1,000 GDP constant 2021 PPP | 2023 | |
| KosovoXKX | 133.25 kg of oil equivalent per $1,000 GDP constant 2021 PPP | 2014 | |
| SudanSDN | 131.47 kg of oil equivalent per $1,000 GDP constant 2021 PPP | 2022 | |
| RwandaRWA | 128.95 kg of oil equivalent per $1,000 GDP constant 2021 PPP | 2022 | |
| CanadaCAN | 127.55 kg of oil equivalent per $1,000 GDP constant 2021 PPP | 2023 | |
| Burkina FasoBFA | 126.73 kg of oil equivalent per $1,000 GDP constant 2021 PPP | 2022 | |
| ChinaCHN | 125.66 kg of oil equivalent per $1,000 GDP constant 2021 PPP | 2023 | |
| Brunei DarussalamBRN | 124.9 kg of oil equivalent per $1,000 GDP constant 2021 PPP | 2022 | |
| MongoliaMNG | 123.49 kg of oil equivalent per $1,000 GDP constant 2021 PPP | 2022 | |
| HaitiHTI | 123.48 kg of oil equivalent per $1,000 GDP constant 2021 PPP | 2022 | |
| United Arab EmiratesARE | 118.95 kg of oil equivalent per $1,000 GDP constant 2021 PPP | 2022 | |
| TanzaniaTZA | 117.83 kg of oil equivalent per $1,000 GDP constant 2021 PPP | 2022 | |
| Bosnia and HerzegovinaBIH | 115.21 kg of oil equivalent per $1,000 GDP constant 2021 PPP | 2023 | |
| GabonGAB | 112.33 kg of oil equivalent per $1,000 GDP constant 2021 PPP | 2022 | |
| Saudi ArabiaSAU | 112.08 kg of oil equivalent per $1,000 GDP constant 2021 PPP | 2022 | |
| NepalNPL | 109.16 kg of oil equivalent per $1,000 GDP constant 2021 PPP | 2022 | |
| BelarusBLR | 107.87 kg of oil equivalent per $1,000 GDP constant 2021 PPP | 2022 | |
| KazakhstanKAZ | 105.19 kg of oil equivalent per $1,000 GDP constant 2021 PPP | 2023 | |
| IraqIRQ | 105.08 kg of oil equivalent per $1,000 GDP constant 2021 PPP | 2022 | |
| Kyrgyz RepublicKGZ | 105.05 kg of oil equivalent per $1,000 GDP constant 2021 PPP | 2022 | |
| BeninBEN | 104.73 kg of oil equivalent per $1,000 GDP constant 2021 PPP | 2022 | |
| FinlandFIN | 104.29 kg of oil equivalent per $1,000 GDP constant 2021 PPP | 2023 | |
| SeychellesSYC | 104.28 kg of oil equivalent per $1,000 GDP constant 2021 PPP | 2007 | |
| Syrian Arab RepublicSYR | 102.03 kg of oil equivalent per $1,000 GDP constant 2021 PPP | 2022 | |
| UkraineUKR | 101.41 kg of oil equivalent per $1,000 GDP constant 2021 PPP | 2023 | |
| Congo, Rep.COG | 101.14 kg of oil equivalent per $1,000 GDP constant 2021 PPP | 2022 | |
| Lao PDRLAO | 99.61 kg of oil equivalent per $1,000 GDP constant 2021 PPP | 2022 | |
| AlgeriaDZA | 99.17 kg of oil equivalent per $1,000 GDP constant 2021 PPP | 2023 | |
| Korea, Rep.KOR | 98.78 kg of oil equivalent per $1,000 GDP constant 2021 PPP | 2023 |
Source: World Bank (WB WDI)