Fertilizer consumption (% of fertilizer production)
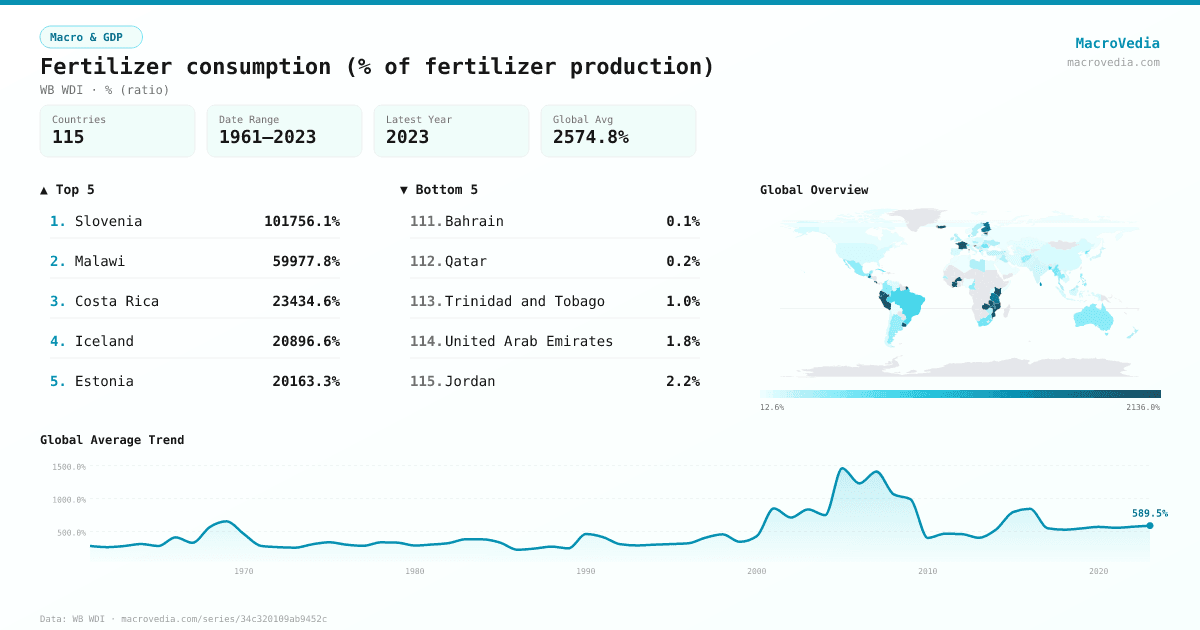
Macro & GDPWB WDIwb_wdi:AG.CON.FERT.PT.ZS•% (ratio)•1961 → 2023•115 countries
Series quick facts
High-level context for this country series.
Macro & GDPWB WDI
Coverage
115
Frequency
—
Range
1961 \u2192 2023
Latest
2023
Fertilizer consumption (% of fertilizer production) by country
Latest available value per country (as of 2023)
Low \u2192 High
Unit: %
≤ 17.2%
17.2% – 67.81%
67.81% – 120.37%
120.37% – 252.81%
252.81% – 441.96%
441.96% – 1,502.02%
> 1,502.02%
No data
Generated by MacroVedia.comSource: World Bank (WB WDI)
Highest 15 countries
Fertilizer consumption (% of fertilizer production)
50 countries with data
Generated by MacroVedia.comSource: World Bank (WB WDI)
Distribution across countries
Fertilizer consumption (% of fertilizer production)
Countries
50
Median
676.1%
Mean
5,883.7%
25th pctl
405.7%
75th pctl
2,100%
Generated by MacroVedia.comSource: World Bank (WB WDI)
Compare trends
Fertilizer consumption (% of fertilizer production)
FinlandBrazilCuba
Generated by MacroVedia.comSource: World Bank (WB WDI)
| Country | Latest | Date | Trend |
|---|---|---|---|
| SloveniaSVN | 101,756.14% | 2005 | |
| MalawiMWI | 59,977.78% | 2009 | |
| Costa RicaCRI | 23,434.6% | 2001 | |
| IcelandISL | 20,896.55% | 2001 | |
| EstoniaEST | 20,163.27% | 2023 | |
| PeruPER | 11,382.05% | 2001 | |
| Burkina FasoBFA | 8,857.18% | 2000 | |
| FranceFRA | 7,180.74% | 2023 | |
| KenyaKEN | 5,550% | 1967 | |
| ZambiaZMB | 3,487.89% | 2000 | |
| EcuadorECU | 2,436.2% | 1984 | |
| Cote d'IvoireCIV | 2,160% | 1993 | |
| MozambiqueMOZ | 2,100% | 1983 | |
| UruguayURY | 1,885.23% | 2019 | |
| FinlandFIN | 1,716.04% | 2023 | |
| TanzaniaTZA | 1,550.75% | 2023 | |
| GuatemalaGTM | 1,518.27% | 1992 | |
| Sri LankaLKA | 1,461.4% | 2023 | |
| CameroonCMR | 1,416.67% | 1977 | |
| AlbaniaALB | 1,250% | 1998 | |
| MauritiusMUS | 1,030.77% | 2004 | |
| El SalvadorSLV | 833.81% | 1991 | |
| MyanmarMMR | 819.28% | 2020 | |
| BrazilBRA | 718.3% | 2023 | |
| CubaCUB | 684.64% | 2023 | |
| BangladeshBGD | 667.52% | 2023 | |
| SwitzerlandCHE | 592.95% | 2000 | |
| RomaniaROU | 544.15% | 2023 | |
| ArmeniaARM | 523.6% | 2002 | — |
| South AfricaZAF | 491.11% | 2023 | |
| Korea, Dem. People's Rep.PRK | 472.44% | 2019 | |
| PhilippinesPHL | 459.18% | 2023 | |
| Bosnia and HerzegovinaBIH | 447.02% | 2021 | |
| SenegalSEN | 438.17% | 2022 | |
| ThailandTHA | 423.27% | 2023 | |
| ColombiaCOL | 411.63% | 2022 | |
| AustraliaAUS | 409.51% | 2023 | |
| MexicoMEX | 405.66% | 2023 | |
| North MacedoniaMKD | 399% | 2000 | |
| EswatiniSWZ | 346% | 1983 | |
| ArgentinaARG | 345.37% | 2023 | |
| DenmarkDNK | 327.58% | 2004 | |
| AfghanistanAFG | 324.29% | 2023 | |
| CzechiaCZE | 311.6% | 2023 | |
| IrelandIRL | 287.43% | 2002 | |
| SwedenSWE | 264.45% | 2007 | |
| UkraineUKR | 262.75% | 2021 | |
| MalaysiaMYS | 256.39% | 2023 | |
| ZimbabweZWE | 253.26% | 2022 | |
| LibyaLBY | 252.73% | 2023 |
Source: World Bank (WB WDI)