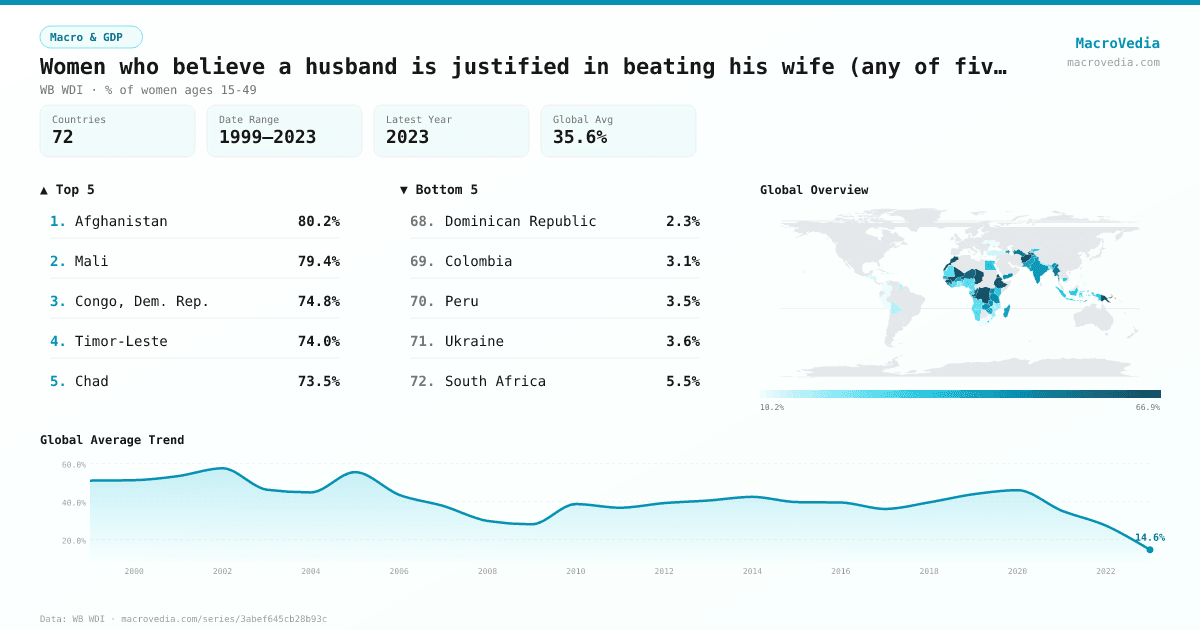
Women who believe a husband is justified in beating his wife (any of five reasons) (%)
Macro & GDPWB WDIwb_wdi:SG.VAW.REAS.ZS•% of women ages 15-49•1999 → 2023•72 countries
Series quick facts
High-level context for this country series.
Macro & GDPWB WDI
Coverage
72
Frequency
—
Range
1999 \u2192 2023
Latest
2022
Women who believe a husband is justified in beating his wife (any of five reasons) (%) by country
Latest available value per country (as of 2022)
Low \u2192 High
Unit: %
≤ 12.61%
12.61% – 20.3%
20.3% – 31.89%
31.89% – 39.96%
39.96% – 48.91%
48.91% – 62.83%
> 62.83%
No data
Generated by MacroVedia.comSource: World Bank (WB WDI)
Highest 15 countries
Women who believe a husband is justified in beating his wife (any of five reasons) (%)
50 countries with data
Generated by MacroVedia.comSource: World Bank (WB WDI)
Distribution across countries
Women who believe a husband is justified in beating his wife (any of five reasons) (%)
Countries
50
Median
47.2%
Mean
47.4%
25th pctl
33.7%
75th pctl
60.7%
Generated by MacroVedia.comSource: World Bank (WB WDI)
Compare trends
Women who believe a husband is justified in beating his wife (any of five reasons) (%)
SenegalRwandaMali
Generated by MacroVedia.comSource: World Bank (WB WDI)
| Country | Latest | Date | Trend |
|---|---|---|---|
| AfghanistanAFG | 80.2% | 2015 | — |
| MaliMLI | 79.4% | 2018 | |
| Congo, Dem. Rep.COD | 74.8% | 2014 | |
| Timor-LesteTLS | 74% | 2016 | |
| ChadTCD | 73.5% | 2015 | — |
| EritreaERI | 70.7% | 2002 | — |
| Papua New GuineaPNG | 69.8% | 2018 | — |
| GuineaGIN | 67.2% | 2018 | |
| MoroccoMAR | 63.9% | 2004 | — |
| TajikistanTJK | 63.6% | 2017 | |
| EthiopiaETH | 63% | 2016 | |
| BurundiBDI | 61.8% | 2017 | |
| Congo, Rep.COG | 60.7% | 2012 | |
| NigerNER | 59.6% | 2012 | |
| TurkmenistanTKM | 51.7% | 2000 | — |
| Gambia, TheGMB | 51.4% | 2020 | |
| MyanmarMMR | 51.2% | 2016 | — |
| GabonGAB | 50.2% | 2012 | — |
| RwandaRWA | 49.6% | 2020 | |
| AzerbaijanAZE | 49% | 2006 | — |
| UgandaUGA | 49% | 2016 | |
| Yemen, Rep.YEM | 48.7% | 2013 | — |
| Sierra LeoneSLE | 48.6% | 2019 | |
| Cote d'IvoireCIV | 47.9% | 2012 | — |
| TanzaniaTZA | 47.8% | 2022 | |
| CameroonCMR | 46.5% | 2011 | |
| ZambiaZMB | 45.1% | 2018 | |
| IndiaIND | 44.4% | 2021 | |
| Burkina FasoBFA | 44.1% | 2021 | |
| PakistanPAK | 41.1% | 2018 | |
| MadagascarMDG | 40.6% | 2021 | |
| SenegalSEN | 39.1% | 2019 | |
| ComorosCOM | 39% | 2012 | — |
| ZimbabweZWE | 38.7% | 2015 | |
| CambodiaKHM | 37.1% | 2022 | |
| LiberiaLBR | 37% | 2020 | |
| Egypt, Arab Rep.EGY | 35.7% | 2014 | |
| Kyrgyz RepublicKGZ | 33.7% | 2012 | — |
| LesothoLSO | 33.3% | 2014 | |
| KenyaKEN | 32.4% | 2022 | |
| IndonesiaIDN | 32% | 2017 | |
| BeninBEN | 31.8% | 2018 | |
| AlbaniaALB | 29.8% | 2009 | — |
| TogoTGO | 28.7% | 2014 | — |
| NamibiaNAM | 28.2% | 2013 | |
| NigeriaNGA | 28% | 2018 | |
| MauritaniaMRT | 27.1% | 2021 | — |
| AngolaAGO | 25.2% | 2016 | — |
| EswatiniSWZ | 23.2% | 2007 | — |
| MaldivesMDV | 22% | 2017 |
Source: World Bank (WB WDI)