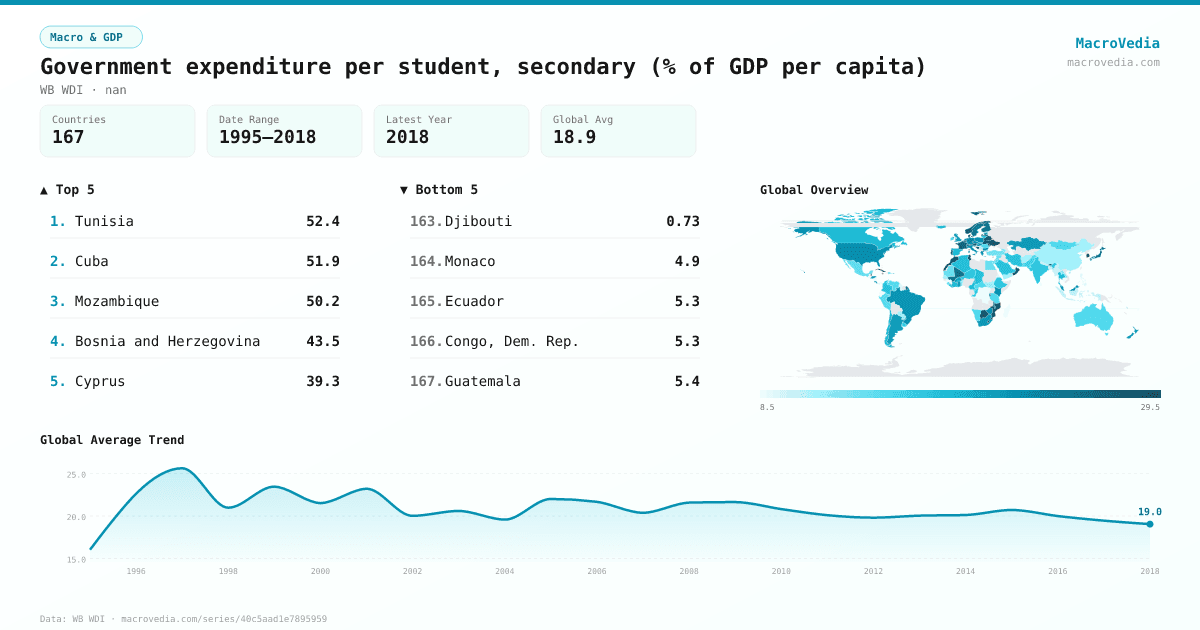
Government expenditure per student, secondary (% of GDP per capita)
Macro & GDPWB WDIwb_wdi:SE.XPD.SECO.PC.ZS•nan•1995 → 2018•167 countries
Series quick facts
High-level context for this country series.
Macro & GDPWB WDI
Coverage
167
Frequency
—
Range
1995 \u2192 2018
Latest
2018
Government expenditure per student, secondary (% of GDP per capita) by country
Latest available value per country (as of 2018)
Low \u2192 High
Unit: %
≤ 10.75%
10.75% – 14.25%
14.25% – 17.16%
17.16% – 19.89%
19.89% – 22.78%
22.78% – 27.74%
> 27.74%
No data
Generated by MacroVedia.comSource: World Bank (WB WDI)
Highest 15 countries
Government expenditure per student, secondary (% of GDP per capita)
50 countries with data
Generated by MacroVedia.comSource: World Bank (WB WDI)
Distribution across countries
Government expenditure per student, secondary (% of GDP per capita)
Countries
50
Median
27.7%
Mean
30.6%
25th pctl
23.9%
75th pctl
31.2%
Generated by MacroVedia.comSource: World Bank (WB WDI)
Compare trends
Government expenditure per student, secondary (% of GDP per capita)
AustriaLatviaSweden
Generated by MacroVedia.comSource: World Bank (WB WDI)
| Country | Latest | Date | Trend |
|---|---|---|---|
| VanuatuVUT | 88.91% | 2001 | |
| TunisiaTUN | 52.4% | 2015 | |
| CubaCUB | 51.86% | 2010 | |
| MozambiqueMOZ | 50.24% | 2013 | |
| Bosnia and HerzegovinaBIH | 43.51% | 2016 | — |
| CyprusCYP | 39.29% | 2016 | |
| RwandaRWA | 37.15% | 2016 | |
| MoroccoMAR | 36.36% | 2012 | |
| OmanOMN | 36.03% | 2017 | |
| BotswanaBWA | 35.87% | 2009 | |
| BelarusBLR | 35.67% | 2017 | — |
| MauritiusMUS | 31.32% | 2018 | |
| BurundiBDI | 31.25% | 2013 | |
| DenmarkDNK | 31.14% | 2014 | |
| MoldovaMDA | 31.09% | 2018 | |
| UkraineUKR | 30.26% | 2017 | |
| LesothoLSO | 30% | 2018 | |
| JamaicaJAM | 29.73% | 2018 | |
| MaltaMLT | 29.55% | 2015 | |
| BhutanBTN | 29.43% | 2015 | |
| EswatiniSWZ | 28.23% | 2014 | |
| Korea, Rep.KOR | 28.18% | 2016 | |
| BarbadosBRB | 28.04% | 2016 | |
| Marshall IslandsMHL | 27.8% | 2002 | — |
| AustriaAUT | 27.72% | 2016 | |
| PortugalPRT | 27.69% | 2015 | |
| BelizeBLZ | 27.32% | 2017 | |
| NorwayNOR | 26.79% | 2016 | |
| LatviaLVA | 26.43% | 2016 | |
| FranceFRA | 26.28% | 2016 | |
| MaliMLI | 25.5% | 2017 | |
| ArubaABW | 25.1% | 2012 | |
| FinlandFIN | 24.75% | 2016 | |
| BelgiumBEL | 24.53% | 2013 | — |
| SwitzerlandCHE | 24.46% | 2015 | |
| JapanJPN | 24.05% | 2016 | |
| MalawiMWI | 24.03% | 2016 | |
| Cayman IslandsCYM | 23.94% | 2006 | |
| SwedenSWE | 23.76% | 2016 | |
| Brunei DarussalamBRN | 23.64% | 2016 | |
| NetherlandsNLD | 23.12% | 2016 | |
| HungaryHUN | 23.06% | 2016 | |
| SloveniaSVN | 23.04% | 2016 | |
| GreeceGRC | 23.02% | 2016 | |
| GermanyDEU | 22.96% | 2016 | |
| CuracaoCUW | 22.94% | 2013 | — |
| ItalyITA | 22.9% | 2015 | |
| MalaysiaMYS | 22.81% | 2018 | |
| St. LuciaLCA | 22.74% | 2018 | |
| PolandPOL | 22.56% | 2016 |
Source: World Bank (WB WDI)