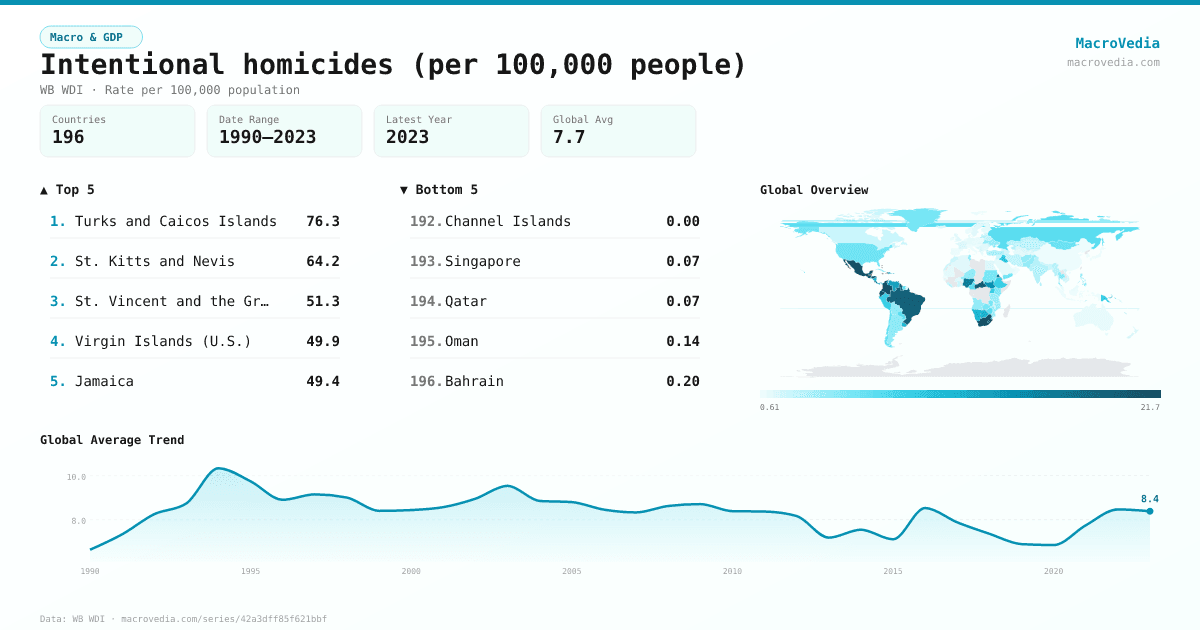
Intentional homicides (per 100,000 people)
Macro & GDPWB WDIwb_wdi:VC.IHR.PSRC.P5•Rate per 100,000 population•1990 → 2023•196 countries
Series quick facts
High-level context for this country series.
Macro & GDPWB WDI
Coverage
196
Frequency
yearly
Range
1990 \u2192 2023
Latest
2023
Spotlight
Turks and Caicos Islands
TCA
76.34 Rate per 100,000 population
2022
St. Kitts and Nevis
KNA
64.1601 Rate per 100,000 population
2023
St. Vincent and the Grenadines
VCT
51.3213 Rate per 100,000 population
2023
Virgin Islands (U.S.)
VIR
49.8571 Rate per 100,000 population
2012
Jamaica
JAM
49.4403 Rate per 100,000 population
2023
Ecuador
ECU
45.7228 Rate per 100,000 population
2023
Intentional homicides (per 100,000 people) by country
Latest available value per country (as of 2023)
Low \u2192 High
Unit: Rate per 100,000 population
≤ 0.76
0.76 – 1.37
1.37 – 2.43
2.43 – 4.05
4.05 – 6.76
6.76 – 15.91
> 15.91
No data
Generated by MacroVedia.comSource: World Bank (WB WDI)
Highest 15 countries
Intentional homicides (per 100,000 people)
50 countries with data
Generated by MacroVedia.comSource: World Bank (WB WDI)
Distribution across countries
Intentional homicides (per 100,000 people)
Countries
50
Median
17.6
Mean
23.9
25th pctl
11.7
75th pctl
31.4
Generated by MacroVedia.comSource: World Bank (WB WDI)
Compare trends
Intentional homicides (per 100,000 people)
JamaicaSt. LuciaColombia
Generated by MacroVedia.comSource: World Bank (WB WDI)
| Country | Latest | Date | Trend |
|---|---|---|---|
| Turks and Caicos IslandsTCA | 76.34 Rate per 100,000 population | 2022 | |
| St. Kitts and NevisKNA | 64.16 Rate per 100,000 population | 2023 | |
| St. Vincent and the GrenadinesVCT | 51.32 Rate per 100,000 population | 2023 | |
| Virgin Islands (U.S.)VIR | 49.86 Rate per 100,000 population | 2012 | |
| JamaicaJAM | 49.44 Rate per 100,000 population | 2023 | |
| EcuadorECU | 45.72 Rate per 100,000 population | 2023 | |
| South AfricaZAF | 43.72 Rate per 100,000 population | 2022 | |
| HaitiHTI | 41.15 Rate per 100,000 population | 2023 | |
| Trinidad and TobagoTTO | 40.44 Rate per 100,000 population | 2022 | |
| St. LuciaLCA | 39.04 Rate per 100,000 population | 2023 | |
| LesothoLSO | 38.24 Rate per 100,000 population | 2008 | |
| Bahamas, TheBHS | 32.2 Rate per 100,000 population | 2022 | |
| HondurasHND | 31.44 Rate per 100,000 population | 2023 | |
| BelizeBLZ | 28.06 Rate per 100,000 population | 2022 | |
| DominicaDMA | 27.06 Rate per 100,000 population | 2023 | |
| St. Martin (French part)MAF | 26.9 Rate per 100,000 population | 2016 | |
| American SamoaASM | 25.54 Rate per 100,000 population | 2018 | |
| ColombiaCOL | 24.91 Rate per 100,000 population | 2023 | |
| MexicoMEX | 24.86 Rate per 100,000 population | 2023 | |
| GuatemalaGTM | 23.37 Rate per 100,000 population | 2023 | |
| Central African RepublicCAF | 20.12 Rate per 100,000 population | 2016 | — |
| BrazilBRA | 19.28 Rate per 100,000 population | 2023 | |
| GuyanaGUY | 19.12 Rate per 100,000 population | 2023 | |
| TuvaluTUV | 18.29 Rate per 100,000 population | 2012 | |
| Costa RicaCRI | 17.75 Rate per 100,000 population | 2023 | |
| British Virgin IslandsVGB | 17.48 Rate per 100,000 population | 2004 | |
| El SalvadorSLV | 17.34 Rate per 100,000 population | 2021 | |
| CuracaoCUW | 16.92 Rate per 100,000 population | 2007 | |
| NigeriaNGA | 15.75 Rate per 100,000 population | 2023 | |
| EritreaERI | 15.61 Rate per 100,000 population | 2012 | — |
| BarbadosBRB | 15.23 Rate per 100,000 population | 2022 | |
| Puerto Rico (US)PRI | 14.59 Rate per 100,000 population | 2023 | |
| South SudanSSD | 13.98 Rate per 100,000 population | 2012 | — |
| BermudaBMU | 13.9 Rate per 100,000 population | 2022 | |
| GrenadaGRD | 13.67 Rate per 100,000 population | 2023 | |
| Venezuela, RBVEN | 12.65 Rate per 100,000 population | 2022 | |
| EswatiniSWZ | 12.51 Rate per 100,000 population | 2021 | |
| PanamaPAN | 11.71 Rate per 100,000 population | 2023 | |
| BotswanaBWA | 11.37 Rate per 100,000 population | 2021 | |
| NicaraguaNIC | 11.35 Rate per 100,000 population | 2021 | |
| UruguayURY | 11.25 Rate per 100,000 population | 2023 | |
| PalauPLW | 11.23 Rate per 100,000 population | 2018 | |
| NamibiaNAM | 11.21 Rate per 100,000 population | 2021 | |
| Dominican RepublicDOM | 10.92 Rate per 100,000 population | 2023 | |
| Antigua and BarbudaATG | 10.72 Rate per 100,000 population | 2023 | |
| TongaTON | 9.47 Rate per 100,000 population | 2018 | |
| IraqIRQ | 9.46 Rate per 100,000 population | 2013 | |
| Papua New GuineaPNG | 9.34 Rate per 100,000 population | 2010 | |
| UgandaUGA | 8.97 Rate per 100,000 population | 2023 | |
| PeruPER | 8.6 Rate per 100,000 population | 2021 |
Source: World Bank (WB WDI)