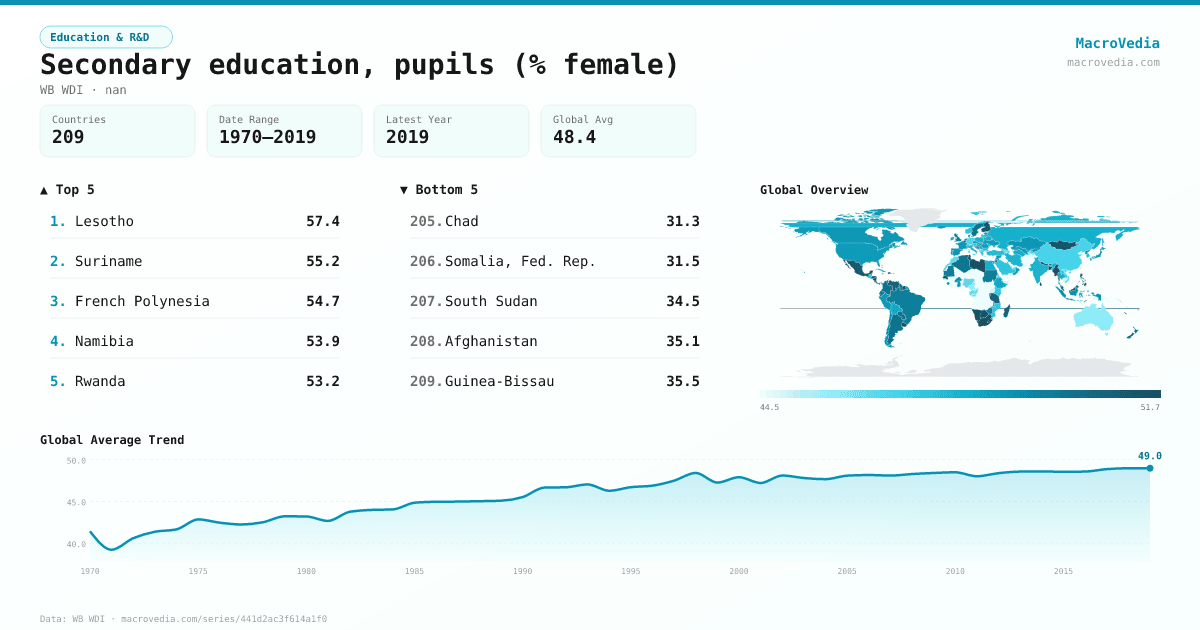
Secondary education, pupils (% female)
Education & R&DWB WDIwb_wdi:SE.SEC.ENRL.FE.ZS•nan•1970 → 2019•209 countries
Series quick facts
High-level context for this country series.
Education & R&DWB WDI
Coverage
209
Frequency
yearly
Range
1970 \u2192 2019
Latest
2019
Secondary education, pupils (% female) by country
Latest available value per country (as of 2019)
Low \u2192 High
Unit: %
≤ 46.22%
46.22% – 48.02%
48.02% – 48.81%
48.81% – 49.22%
49.22% – 50.05%
50.05% – 51.3%
> 51.3%
No data
Generated by MacroVedia.comSource: World Bank (WB WDI)
Highest 15 countries
Secondary education, pupils (% female)
50 countries with data
Generated by MacroVedia.comSource: World Bank (WB WDI)
Distribution across countries
Secondary education, pupils (% female)
Countries
50
Median
51.5%
Mean
51.8%
25th pctl
51.1%
75th pctl
52%
Generated by MacroVedia.comSource: World Bank (WB WDI)
Compare trends
Secondary education, pupils (% female)
Costa RicaLesothoFinland
Generated by MacroVedia.comSource: World Bank (WB WDI)
| Country | Latest | Date | Trend |
|---|---|---|---|
| LesothoLSO | 57.38% | 2017 | |
| SurinameSUR | 55.18% | 2015 | |
| French PolynesiaPYF | 54.73% | 1993 | |
| NamibiaNAM | 53.86% | 2007 | |
| RwandaRWA | 53.16% | 2018 | |
| Sao Tome and PrincipeSTP | 53.14% | 2017 | |
| LibyaLBY | 52.9% | 2006 | |
| BurundiBDI | 52.69% | 2018 | |
| BangladeshBGD | 52.64% | 2018 | |
| HondurasHND | 52.46% | 2017 | |
| Cabo VerdeCPV | 52.22% | 2018 | |
| BhutanBTN | 52.01% | 2018 | |
| TuvaluTUV | 51.97% | 2018 | |
| BermudaBMU | 51.96% | 2015 | |
| MaldivesMDV | 51.93% | 2004 | |
| MyanmarMMR | 51.9% | 2018 | |
| BotswanaBWA | 51.9% | 2008 | |
| SenegalSEN | 51.87% | 2018 | |
| British Virgin IslandsVGB | 51.8% | 2017 | |
| New CaledoniaNCL | 51.76% | 1997 | |
| Bahamas, TheBHS | 51.74% | 2018 | |
| NicaraguaNIC | 51.71% | 2010 | |
| South AfricaZAF | 51.7% | 2017 | |
| BelgiumBEL | 51.68% | 2017 | |
| UruguayURY | 51.56% | 2017 | |
| West Bank and GazaPSE | 51.45% | 2018 | |
| NepalNPL | 51.43% | 2019 | |
| St. Kitts and NevisKNA | 51.4% | 2016 | |
| TunisiaTUN | 51.37% | 2016 | |
| Timor-LesteTLS | 51.33% | 2018 | |
| MongoliaMNG | 51.28% | 2010 | |
| Dominican RepublicDOM | 51.26% | 2018 | |
| KiribatiKIR | 51.2% | 2008 | |
| LebanonLBN | 51.2% | 2018 | |
| FinlandFIN | 51.17% | 2017 | |
| Sri LankaLKA | 51.12% | 2018 | |
| MexicoMEX | 51.09% | 2017 | |
| Trinidad and TobagoTTO | 51.07% | 2004 | |
| FijiFJI | 51% | 2012 | |
| CuracaoCUW | 50.89% | 2013 | — |
| Venezuela, RBVEN | 50.88% | 2017 | |
| PhilippinesPHL | 50.83% | 2017 | |
| TanzaniaTZA | 50.83% | 2018 | |
| ComorosCOM | 50.78% | 2018 | |
| Costa RicaCRI | 50.68% | 2018 | |
| SamoaWSM | 50.66% | 2016 | |
| SeychellesSYC | 50.64% | 2018 | |
| MadagascarMDG | 50.61% | 2018 | |
| BelizeBLZ | 50.59% | 2018 | |
| MalaysiaMYS | 50.48% | 2018 |
Source: World Bank (WB WDI)