Children in employment, study and work, male (% of male children in employment, ages 7-
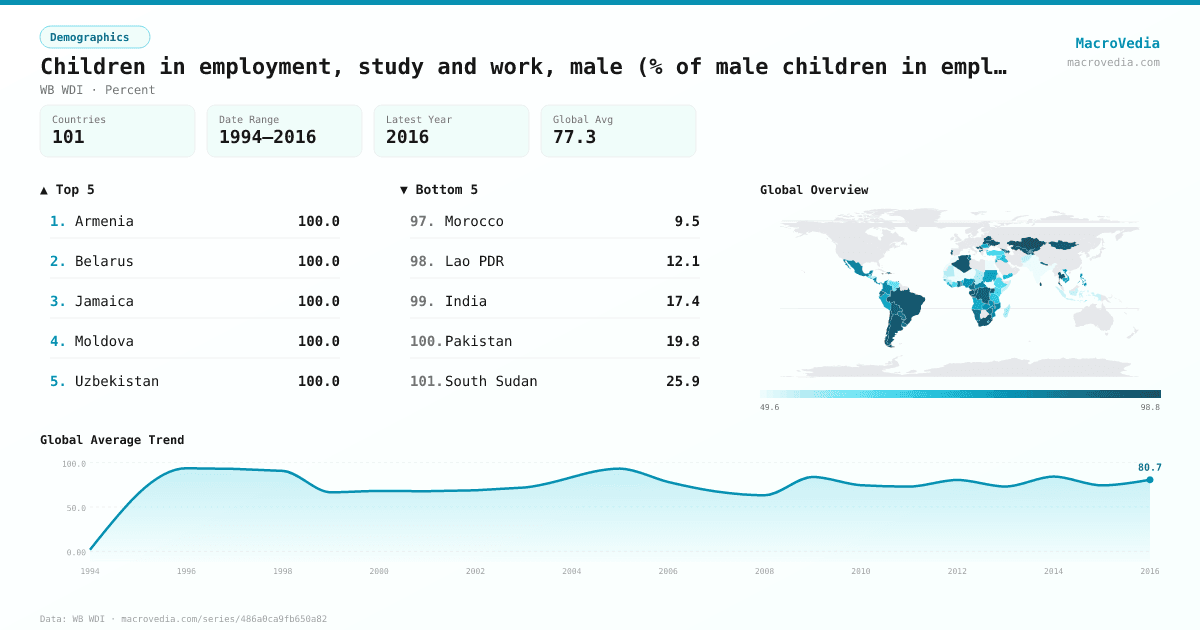
DemographicsWB WDIwb_wdi:SL.TLF.0714.SW.MA.ZS•Percent•1994 → 2016•101 countries
Series quick facts
High-level context for this country series.
DemographicsWB WDI
Coverage
101
Frequency
—
Range
1994 \u2192 2016
Latest
2016
Children in employment, study and work, male (% of male children in employment, ages 7- by country
Latest available value per country (as of 2016)
Low \u2192 High
Unit: %
≤ 54.81%
54.81% – 71.6%
71.6% – 78.9%
78.9% – 87.22%
87.22% – 92.95%
92.95% – 96.29%
> 96.29%
No data
Generated by MacroVedia.comSource: World Bank (WB WDI)
Highest 15 countries
Children in employment, study and work, male (% of male children in employment, ages 7-
101 countries with data
Generated by MacroVedia.comSource: World Bank (WB WDI)
Distribution across countries
Children in employment, study and work, male (% of male children in employment, ages 7-
Countries
101
Median
82.7%
Mean
77.8%
25th pctl
66.5%
75th pctl
94.2%
Generated by MacroVedia.comSource: World Bank (WB WDI)
Compare trends
Children in employment, study and work, male (% of male children in employment, ages 7-
BrazilRwandaKyrgyz Republic
Generated by MacroVedia.comSource: World Bank (WB WDI)
| Country | Latest | Date | Trend |
|---|---|---|---|
| ArmeniaARM | 100% | 2010 | — |
| BelarusBLR | 100% | 2012 | — |
| JamaicaJAM | 100% | 2011 | — |
| MoldovaMDA | 100% | 2009 | |
| UzbekistanUZB | 100% | 2005 | |
| Bosnia and HerzegovinaBIH | 99.8% | 2006 | |
| Kyrgyz RepublicKGZ | 99.74% | 2014 | |
| North MacedoniaMKD | 99.21% | 2011 | — |
| GeorgiaGEO | 99% | 2006 | — |
| ChileCHL | 98.8% | 2012 | |
| KazakhstanKAZ | 98.8% | 2006 | |
| SerbiaSRB | 98.65% | 2014 | |
| UkraineUKR | 97.7% | 2012 | — |
| EswatiniSWZ | 96.95% | 2010 | |
| PortugalPRT | 96.42% | 2001 | — |
| AlgeriaDZA | 95.95% | 2013 | — |
| BrazilBRA | 95.8% | 2015 | |
| Trinidad and TobagoTTO | 95.8% | 2006 | |
| GabonGAB | 95.75% | 2012 | — |
| AlbaniaALB | 95.65% | 2010 | |
| Sri LankaLKA | 95.62% | 2009 | |
| South AfricaZAF | 95.3% | 1999 | — |
| ArgentinaARG | 95.27% | 2012 | — |
| Congo, Rep.COG | 95.2% | 2012 | — |
| ThailandTHA | 95.1% | 2005 | — |
| MongoliaMNG | 94.16% | 2013 | |
| TajikistanTJK | 93.9% | 2005 | — |
| AzerbaijanAZE | 93.7% | 2005 | |
| Dominican RepublicDOM | 93.07% | 2014 | |
| NepalNPL | 92.86% | 2014 | |
| UgandaUGA | 92.82% | 2012 | — |
| Congo, Dem. Rep.COD | 92.61% | 2014 | |
| MalawiMWI | 92.5% | 2015 | |
| BoliviaBOL | 92.46% | 2015 | |
| HaitiHTI | 92.31% | 2012 | — |
| ParaguayPRY | 89.79% | 2014 | |
| EcuadorECU | 89.52% | 2015 | |
| TunisiaTUN | 89.1% | 2012 | — |
| TogoTGO | 88.46% | 2014 | |
| UruguayURY | 87.82% | 2009 | — |
| CameroonCMR | 87.7% | 2011 | |
| NamibiaNAM | 87.66% | 1999 | — |
| GhanaGHA | 87.31% | 2012 | |
| ZimbabweZWE | 87.2% | 1999 | — |
| BelizeBLZ | 85.45% | 2001 | — |
| Costa RicaCRI | 84.8% | 2016 | |
| PanamaPAN | 84.59% | 2014 | |
| MexicoMEX | 84.5% | 2013 | |
| NicaraguaNIC | 83.2% | 2012 | |
| Central African RepublicCAF | 82.87% | 2010 | |
| MozambiqueMOZ | 82.7% | 2008 | — |
| PhilippinesPHL | 82.5% | 2011 | |
| ColombiaCOL | 82.43% | 2015 | |
| El SalvadorSLV | 82.37% | 2013 | |
| BurundiBDI | 81.96% | 2010 | |
| ZambiaZMB | 81.21% | 2008 | — |
| NigeriaNGA | 79.54% | 2011 | |
| Viet NamVNM | 79.1% | 2012 | — |
| LiberiaLBR | 77.68% | 2010 | — |
| SudanSDN | 77.58% | 2014 | |
| PeruPER | 77.4% | 2015 | |
| Guinea-BissauGNB | 77.33% | 2014 | |
| JordanJOR | 76.56% | 2016 | |
| LesothoLSO | 76.45% | 2000 | — |
| CambodiaKHM | 76.4% | 2012 | |
| AngolaAGO | 75.3% | 2001 | — |
| RomaniaROU | 75% | 2000 | — |
| RwandaRWA | 75% | 2014 | |
| Yemen, Rep.YEM | 73.88% | 2010 | |
| Gambia, TheGMB | 73.8% | 2008 | |
| IraqIRQ | 73.1% | 2011 | |
| Sierra LeoneSLE | 71.9% | 2013 | |
| BeninBEN | 71.2% | 2012 | — |
| TanzaniaTZA | 69.34% | 2014 | |
| KenyaKEN | 66.84% | 2009 | |
| TurkiyeTUR | 66.5% | 2006 | |
| Timor-LesteTLS | 65.5% | 2007 | — |
| Cote d'IvoireCIV | 64.81% | 2012 | |
| EthiopiaETH | 64.55% | 2011 | — |
| Syrian Arab RepublicSYR | 64.2% | 2006 | — |
| Venezuela, RBVEN | 62.86% | 2013 | |
| GuatemalaGTM | 62.16% | 2015 | |
| BangladeshBGD | 60.6% | 2006 | |
| MadagascarMDG | 57% | 2007 | |
| ChadTCD | 56.09% | 2015 | |
| GuineaGIN | 54.9% | 2012 | |
| MauritaniaMRT | 54.77% | 2011 | |
| HondurasHND | 54.36% | 2014 | |
| Somalia, Fed. Rep.SOM | 53.9% | 2006 | — |
| AfghanistanAFG | 53.83% | 2011 | — |
| IndonesiaIDN | 53.6% | 2010 | — |
| SenegalSEN | 52.29% | 2015 | |
| NigerNER | 49.6% | 2012 | — |
| Egypt, Arab Rep.EGY | 48% | 2009 | — |
| MaliMLI | 46.1% | 2013 | — |
| Burkina FasoBFA | 44.38% | 2010 | — |
| South SudanSSD | 25.87% | 2008 | — |
| PakistanPAK | 19.79% | 2011 | — |
| IndiaIND | 17.4% | 2012 | |
| Lao PDRLAO | 12.07% | 2010 | — |
| MoroccoMAR | 9.5% | 1999 | — |
Source: World Bank (WB WDI)