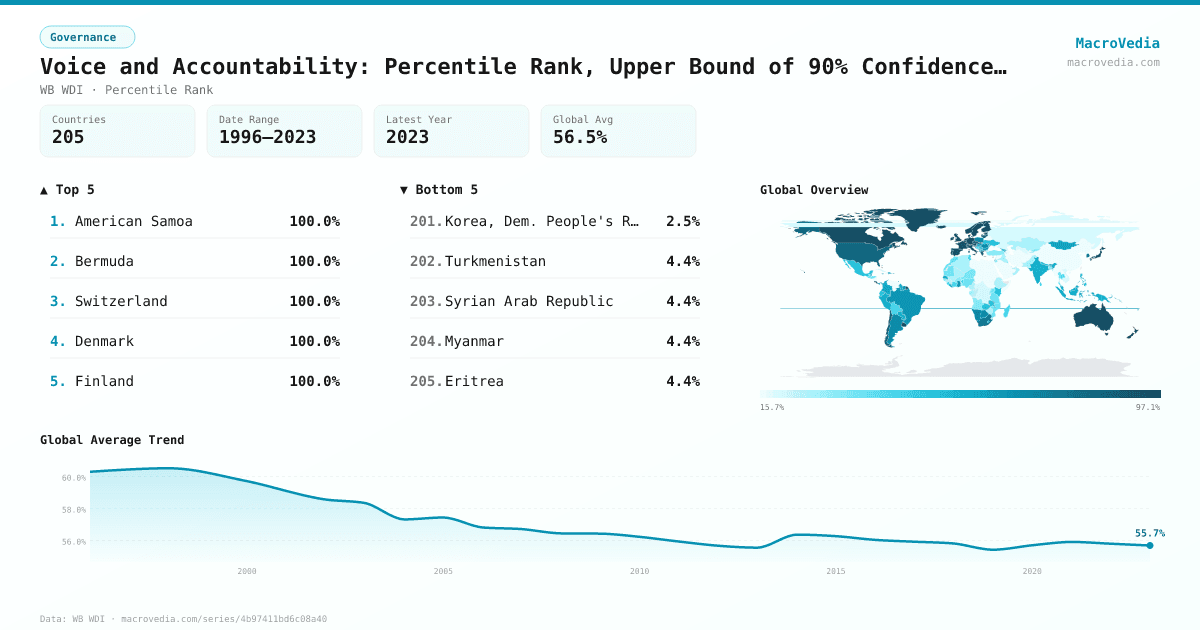
Voice and Accountability: Percentile Rank, Upper Bound of 90% Confidence Interval
GovernanceWB WDIwb_wdi:VA.PER.RNK.UPPER•Percentile Rank•1996 → 2023•205 countries
Series quick facts
High-level context for this country series.
GovernanceWB WDI
Coverage
205
Frequency
yearly
Range
1996 \u2192 2023
Latest
2023
Voice and Accountability: Percentile Rank, Upper Bound of 90% Confidence Interval by country
Latest available value per country (as of 2023)
Low \u2192 High
Unit: %
≤ 20.1%
20.1% – 33.82%
33.82% – 51.68%
51.68% – 62.75%
62.75% – 84.31%
84.31% – 93.63%
> 93.63%
No data
Generated by MacroVedia.comSource: World Bank (WB WDI)
Highest 15 countries
Voice and Accountability: Percentile Rank, Upper Bound of 90% Confidence Interval
50 countries with data
Generated by MacroVedia.comSource: World Bank (WB WDI)
Distribution across countries
Voice and Accountability: Percentile Rank, Upper Bound of 90% Confidence Interval
Countries
50
Median
96.2%
Mean
95.3%
25th pctl
92.6%
75th pctl
99.5%
Generated by MacroVedia.comSource: World Bank (WB WDI)
Compare trends
Voice and Accountability: Percentile Rank, Upper Bound of 90% Confidence Interval
SwitzerlandDenmarkFinland
Generated by MacroVedia.comSource: World Bank (WB WDI)
| Country | Latest | Date | Trend |
|---|---|---|---|
| American SamoaASM | 100% | 2022 | |
| BermudaBMU | 100% | 2013 | |
| SwitzerlandCHE | 100% | 2023 | |
| DenmarkDNK | 100% | 2023 | |
| FinlandFIN | 100% | 2023 | |
| GuamGUM | 100% | 2022 | |
| LuxembourgLUX | 100% | 2023 | |
| NorwayNOR | 100% | 2023 | |
| New ZealandNZL | 100% | 2023 | |
| AustraliaAUS | 99.51% | 2023 | |
| CanadaCAN | 99.51% | 2023 | |
| NetherlandsNLD | 99.51% | 2023 | |
| San MarinoSMR | 99.51% | 2023 | |
| SwedenSWE | 99.51% | 2023 | |
| IrelandIRL | 99.02% | 2023 | |
| IcelandISL | 99.02% | 2023 | |
| LiechtensteinLIE | 99.02% | 2023 | |
| GermanyDEU | 98.04% | 2023 | |
| TuvaluTUV | 98.04% | 2023 | |
| AustriaAUT | 97.06% | 2023 | |
| GreenlandGRL | 97.06% | 2023 | |
| Marshall IslandsMHL | 97.06% | 2023 | |
| Micronesia, Fed. Sts.FSM | 96.57% | 2023 | |
| PalauPLW | 96.57% | 2023 | |
| Virgin Islands (U.S.)VIR | 96.24% | 2013 | |
| BelgiumBEL | 96.08% | 2023 | |
| KiribatiKIR | 96.08% | 2023 | |
| UruguayURY | 95.59% | 2023 | |
| United KingdomGBR | 95.1% | 2023 | |
| AndorraAND | 93.63% | 2023 | |
| SamoaWSM | 93.63% | 2023 | |
| ArubaABW | 92.65% | 2023 | |
| BarbadosBRB | 92.65% | 2023 | |
| SpainESP | 92.65% | 2023 | |
| EstoniaEST | 92.65% | 2023 | |
| FranceFRA | 92.65% | 2023 | |
| JapanJPN | 92.65% | 2023 | |
| PortugalPRT | 92.65% | 2023 | |
| ItalyITA | 92.16% | 2023 | |
| Costa RicaCRI | 91.67% | 2023 | |
| TongaTON | 91.67% | 2023 | |
| CzechiaCZE | 89.71% | 2023 | |
| St. LuciaLCA | 89.71% | 2023 | |
| SloveniaSVN | 89.71% | 2023 | |
| LithuaniaLTU | 89.22% | 2023 | |
| St. Vincent and the GrenadinesVCT | 89.22% | 2023 | |
| ChileCHL | 88.73% | 2023 | |
| Cabo VerdeCPV | 87.25% | 2023 | |
| DominicaDMA | 87.25% | 2023 | |
| GreeceGRC | 87.25% | 2023 |
Source: World Bank (WB WDI)