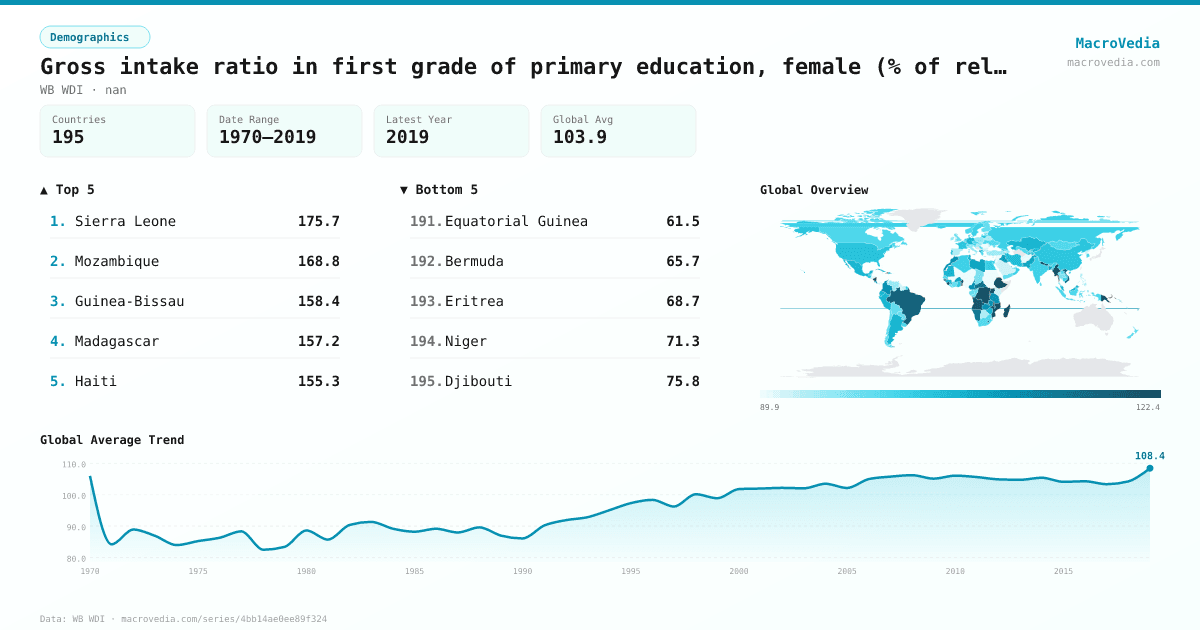
Gross intake ratio in first grade of primary education, female (% of relevant age group)
DemographicsWB WDIwb_wdi:SE.PRM.GINT.FE.ZS•nan•1970 → 2019•195 countries
Series quick facts
High-level context for this country series.
DemographicsWB WDI
Coverage
195
Frequency
yearly
Range
1970 \u2192 2019
Latest
2019
Gross intake ratio in first grade of primary education, female (% of relevant age group) by country
Latest available value per country (as of 2019)
Low \u2192 High
Unit: %
≤ 92.25%
92.25% – 98.06%
98.06% – 99.95%
99.95% – 102.46%
102.46% – 106.25%
106.25% – 113.84%
> 113.84%
No data
Generated by MacroVedia.comSource: World Bank (WB WDI)
Highest 15 countries
Gross intake ratio in first grade of primary education, female (% of relevant age group)
50 countries with data
Generated by MacroVedia.comSource: World Bank (WB WDI)
Distribution across countries
Gross intake ratio in first grade of primary education, female (% of relevant age group)
Countries
50
Median
116%
Mean
123.7%
25th pctl
110%
75th pctl
132.6%
Generated by MacroVedia.comSource: World Bank (WB WDI)
Compare trends
Gross intake ratio in first grade of primary education, female (% of relevant age group)
MaltaLesothoBenin
Generated by MacroVedia.comSource: World Bank (WB WDI)
| Country | Latest | Date | Trend |
|---|---|---|---|
| Sierra LeoneSLE | 175.71% | 2018 | |
| MozambiqueMOZ | 168.83% | 2018 | |
| Guinea-BissauGNB | 158.4% | 2010 | |
| MadagascarMDG | 157.18% | 2018 | |
| HaitiHTI | 155.28% | 1997 | |
| British Virgin IslandsVGB | 150% | 2017 | |
| NepalNPL | 147.53% | 2019 | |
| BeninBEN | 143.51% | 2018 | |
| TogoTGO | 139.78% | 2018 | |
| NicaraguaNIC | 139.74% | 2010 | |
| UgandaUGA | 139.6% | 2017 | |
| Congo, Dem. Rep.COD | 134.71% | 2015 | |
| NauruNRU | 132.56% | 2016 | |
| MyanmarMMR | 130.58% | 2017 | |
| MalawiMWI | 130.13% | 2018 | |
| EthiopiaETH | 129.21% | 2015 | |
| BurundiBDI | 127.03% | 2018 | |
| Sint Maarten (Dutch part)SXM | 125% | 2014 | |
| Papua New GuineaPNG | 124.3% | 2016 | |
| RwandaRWA | 123.61% | 2018 | |
| AngolaAGO | 120.48% | 2011 | |
| BrazilBRA | 118.19% | 2004 | |
| Hong Kong SAR, ChinaHKG | 117.23% | 2018 | |
| Viet NamVNM | 116.97% | 2018 | |
| San MarinoSMR | 116% | 2018 | |
| SamoaWSM | 115.98% | 2018 | |
| Central African RepublicCAF | 115.69% | 2016 | |
| NamibiaNAM | 113.92% | 2018 | |
| LesothoLSO | 113.81% | 2017 | |
| DominicaDMA | 113.19% | 2016 | |
| St. Vincent and the GrenadinesVCT | 111.59% | 2018 | |
| TongaTON | 111.33% | 2013 | |
| AlbaniaALB | 111.17% | 2018 | |
| Costa RicaCRI | 111.06% | 2018 | |
| ColombiaCOL | 111.01% | 2018 | |
| MoroccoMAR | 110.77% | 2018 | |
| CameroonCMR | 110.48% | 2018 | |
| ZambiaZMB | 110.01% | 2017 | |
| TanzaniaTZA | 109.84% | 2018 | |
| FijiFJI | 109.69% | 2016 | |
| GibraltarGIB | 109.68% | 2017 | |
| BangladeshBGD | 109.29% | 2018 | |
| IraqIRQ | 109.13% | 2007 | |
| MaltaMLT | 109.04% | 2017 | |
| ArubaABW | 108.89% | 2014 | |
| Burkina FasoBFA | 108.13% | 2018 | |
| LibyaLBY | 108% | 1983 | |
| Solomon IslandsSLB | 107.93% | 2018 | |
| QatarQAT | 107.91% | 2018 | |
| PakistanPAK | 107.26% | 2018 |
Source: World Bank (WB WDI)