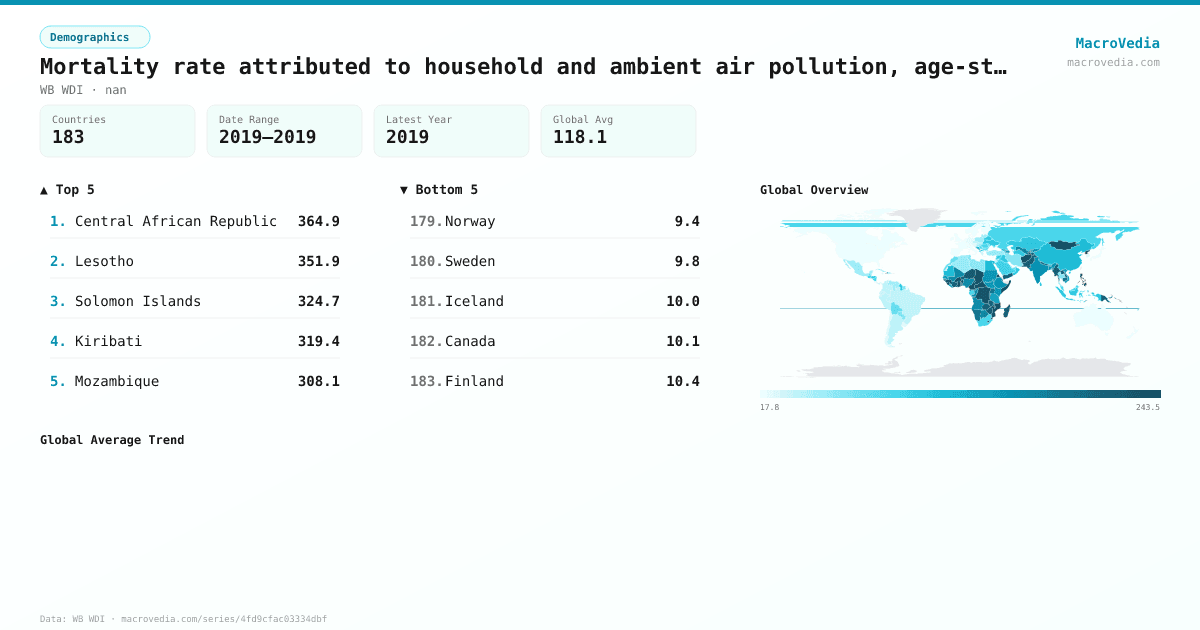
Mortality rate attributed to household and ambient air pollution, age-standardized, male (per 100,000 male population)
DemographicsWB WDIwb_wdi:SH.STA.AIRP.MA.P5•nan•2019 → 2019•183 countries
Series quick facts
High-level context for this country series.
DemographicsWB WDI
Coverage
183
Frequency
—
Range
2019 \u2192 2019
Latest
2019
Mortality rate attributed to household and ambient air pollution, age-standardized, male (per 100,000 male population) by country
Latest available value per country (as of 2019)
Low \u2192 High
Unit: nan
≤ 21.7
21.7 – 43.8
43.8 – 76.7
76.7 – 114.9
114.9 – 168.2
168.2 – 231.5
> 231.5
No data
Generated by MacroVedia.comSource: World Bank (WB WDI)
Highest 15 countries
Mortality rate attributed to household and ambient air pollution, age-standardized, male (per 100,000 male population)
50 countries with data
Generated by MacroVedia.comSource: World Bank (WB WDI)
Distribution across countries
Mortality rate attributed to household and ambient air pollution, age-standardized, male (per 100,000 male population)
Countries
50
Median
232.6
Mean
242.5
25th pctl
208.9
75th pctl
270.6
Generated by MacroVedia.comSource: World Bank (WB WDI)
Compare trends
Mortality rate attributed to household and ambient air pollution, age-standardized, male (per 100,000 male population)
Central African RepublicLesothoSolomon Islands
Generated by MacroVedia.comSource: World Bank (WB WDI)
| Country | Latest | Date | Trend |
|---|---|---|---|
| Central African RepublicCAF | 364.9 nan | 2019 | — |
| LesothoLSO | 351.9 nan | 2019 | — |
| Solomon IslandsSLB | 324.7 nan | 2019 | — |
| KiribatiKIR | 319.4 nan | 2019 | — |
| MozambiqueMOZ | 308.1 nan | 2019 | — |
| VanuatuVUT | 301.8 nan | 2019 | — |
| Micronesia, Fed. Sts.FSM | 301.6 nan | 2019 | — |
| Somalia, Fed. Rep.SOM | 291 nan | 2019 | — |
| EritreaERI | 288.5 nan | 2019 | — |
| MongoliaMNG | 283.9 nan | 2019 | — |
| Guinea-BissauGNB | 276.9 nan | 2019 | — |
| TogoTGO | 271.9 nan | 2019 | — |
| Korea, Dem. People's Rep.PRK | 270.6 nan | 2019 | — |
| AfghanistanAFG | 265.2 nan | 2019 | — |
| GuineaGIN | 263.9 nan | 2019 | — |
| ChadTCD | 251 nan | 2019 | — |
| PhilippinesPHL | 250.8 nan | 2019 | — |
| Burkina FasoBFA | 248.6 nan | 2019 | — |
| EswatiniSWZ | 243.5 nan | 2019 | — |
| Sierra LeoneSLE | 243.4 nan | 2019 | — |
| CameroonCMR | 240.8 nan | 2019 | — |
| Gambia, TheGMB | 240.7 nan | 2019 | — |
| Sao Tome and PrincipeSTP | 236.7 nan | 2019 | — |
| BurundiBDI | 235.8 nan | 2019 | — |
| Congo, Dem. Rep.COD | 233.1 nan | 2019 | — |
| TajikistanTJK | 232.2 nan | 2019 | — |
| GhanaGHA | 231.5 nan | 2019 | — |
| BeninBEN | 227.5 nan | 2019 | — |
| Lao PDRLAO | 226.3 nan | 2019 | — |
| NigerNER | 225.7 nan | 2019 | — |
| PakistanPAK | 225.1 nan | 2019 | — |
| ZimbabweZWE | 225.1 nan | 2019 | — |
| MadagascarMDG | 225 nan | 2019 | — |
| MyanmarMMR | 224.2 nan | 2019 | — |
| Cote d'IvoireCIV | 222.1 nan | 2019 | — |
| ZambiaZMB | 217.9 nan | 2019 | — |
| Papua New GuineaPNG | 212.5 nan | 2019 | — |
| Yemen, Rep.YEM | 208.9 nan | 2019 | — |
| NepalNPL | 204.3 nan | 2019 | — |
| UgandaUGA | 201.1 nan | 2019 | — |
| Timor-LesteTLS | 200.8 nan | 2019 | — |
| HaitiHTI | 199.5 nan | 2019 | — |
| DjiboutiDJI | 199.4 nan | 2019 | — |
| CambodiaKHM | 198.1 nan | 2019 | — |
| MalawiMWI | 197.9 nan | 2019 | — |
| NamibiaNAM | 192.4 nan | 2019 | — |
| RwandaRWA | 188.8 nan | 2019 | — |
| UzbekistanUZB | 179.4 nan | 2019 | — |
| BotswanaBWA | 176.2 nan | 2019 | — |
| ComorosCOM | 174.8 nan | 2019 | — |
Source: World Bank (WB WDI)