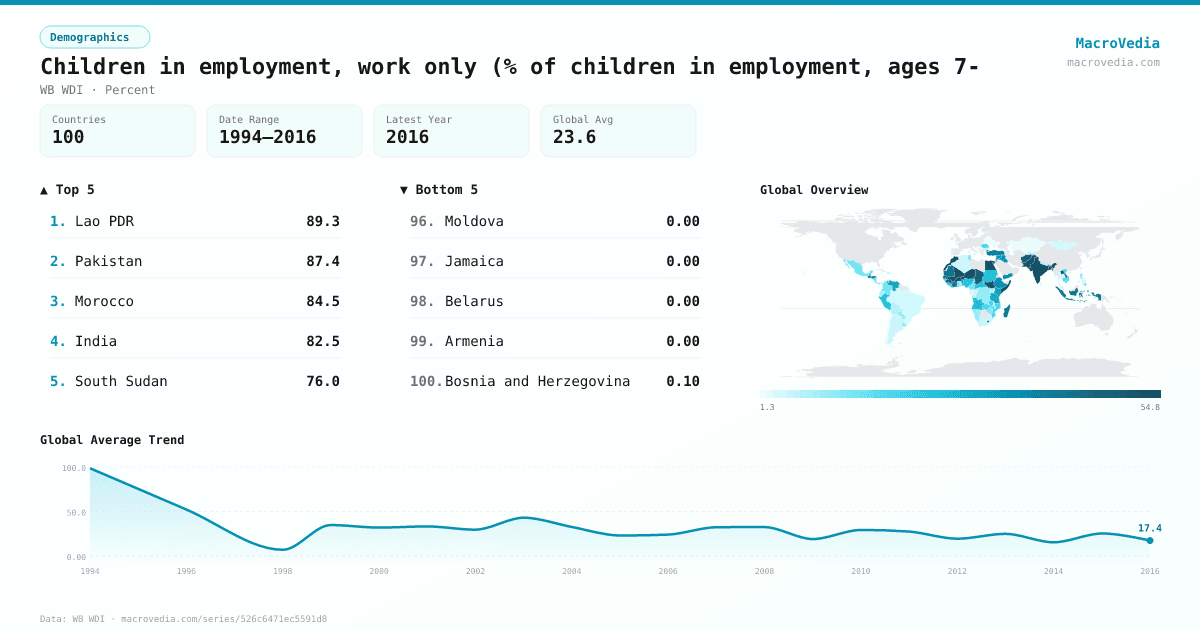
Children in employment, work only (% of children in employment, ages 7-
DemographicsWB WDIwb_wdi:SL.TLF.0714.WK.ZS•Percent•1994 → 2016•100 countries
Series quick facts
High-level context for this country series.
DemographicsWB WDI
Coverage
100
Frequency
—
Range
1994 \u2192 2016
Latest
2016
Children in employment, work only (% of children in employment, ages 7- by country
Latest available value per country (as of 2016)
Low \u2192 High
Unit: %
≤ 3.97%
3.97% – 9.14%
9.14% – 14.95%
14.95% – 23.8%
23.8% – 38.95%
38.95% – 54.99%
> 54.99%
No data
Generated by MacroVedia.comSource: World Bank (WB WDI)
Highest 15 countries
Children in employment, work only (% of children in employment, ages 7-
50 countries with data
Generated by MacroVedia.comSource: World Bank (WB WDI)
Distribution across countries
Children in employment, work only (% of children in employment, ages 7-
Countries
50
Median
44.1%
Mean
47.2%
25th pctl
29.2%
75th pctl
56.8%
Generated by MacroVedia.comSource: World Bank (WB WDI)
Compare trends
Children in employment, work only (% of children in employment, ages 7-
GuatemalaSierra LeoneIndia
Generated by MacroVedia.comSource: World Bank (WB WDI)
| Country | Latest | Date | Trend |
|---|---|---|---|
| MozambiqueMOZ | 100% | 1996 | — |
| Lao PDRLAO | 89.35% | 2010 | |
| PakistanPAK | 87.45% | 2011 | |
| MadagascarMDG | 85.12% | 2001 | — |
| MoroccoMAR | 84.5% | 2004 | |
| IndiaIND | 82.5% | 2012 | |
| South SudanSSD | 76.05% | 2008 | — |
| LesothoLSO | 74.4% | 2002 | |
| SudanSDN | 73.5% | 2008 | |
| EthiopiaETH | 69.4% | 2005 | — |
| TurkiyeTUR | 66.81% | 1999 | — |
| BangladeshBGD | 58.07% | 2013 | |
| Burkina FasoBFA | 56.83% | 2010 | |
| Gambia, TheGMB | 56.63% | 2015 | |
| Egypt, Arab Rep.EGY | 55% | 2009 | |
| Central African RepublicCAF | 54.93% | 2000 | — |
| MaliMLI | 54.8% | 2013 | |
| NigerNER | 54.5% | 2012 | |
| Somalia, Fed. Rep.SOM | 53.5% | 2006 | — |
| AfghanistanAFG | 50% | 2011 | — |
| GuineaGIN | 49.5% | 2012 | |
| ChadTCD | 49.27% | 2015 | |
| LiberiaLBR | 45% | 2007 | — |
| SenegalSEN | 44.74% | 2015 | |
| IndonesiaIDN | 44.4% | 2010 | |
| MauritaniaMRT | 43.71% | 2011 | |
| HondurasHND | 41.75% | 2014 | |
| Cote d'IvoireCIV | 41.15% | 2012 | |
| GuatemalaGTM | 38.97% | 2015 | |
| BurundiBDI | 38.9% | 2005 | |
| Timor-LesteTLS | 36.6% | 2007 | |
| Yemen, Rep.YEM | 35.97% | 2010 | |
| Syrian Arab RepublicSYR | 34.6% | 2006 | — |
| IraqIRQ | 33.6% | 2011 | |
| KenyaKEN | 32.49% | 2009 | |
| BeninBEN | 32.4% | 2012 | |
| Venezuela, RBVEN | 31.13% | 2013 | |
| TanzaniaTZA | 29.22% | 2014 | |
| Sierra LeoneSLE | 26.8% | 2013 | |
| AngolaAGO | 26.6% | 2001 | — |
| Guinea-BissauGNB | 24.21% | 2014 | |
| EcuadorECU | 24.18% | 2011 | |
| PeruPER | 24.07% | 2015 | |
| NigeriaNGA | 23.45% | 2011 | |
| ParaguayPRY | 21.6% | 2005 | — |
| CambodiaKHM | 21.1% | 2012 | |
| RwandaRWA | 20.8% | 2014 | |
| Congo, Dem. Rep.COD | 20.72% | 2010 | |
| RomaniaROU | 20.7% | 2000 | — |
| JordanJOR | 20.02% | 2016 |
Source: World Bank (WB WDI)