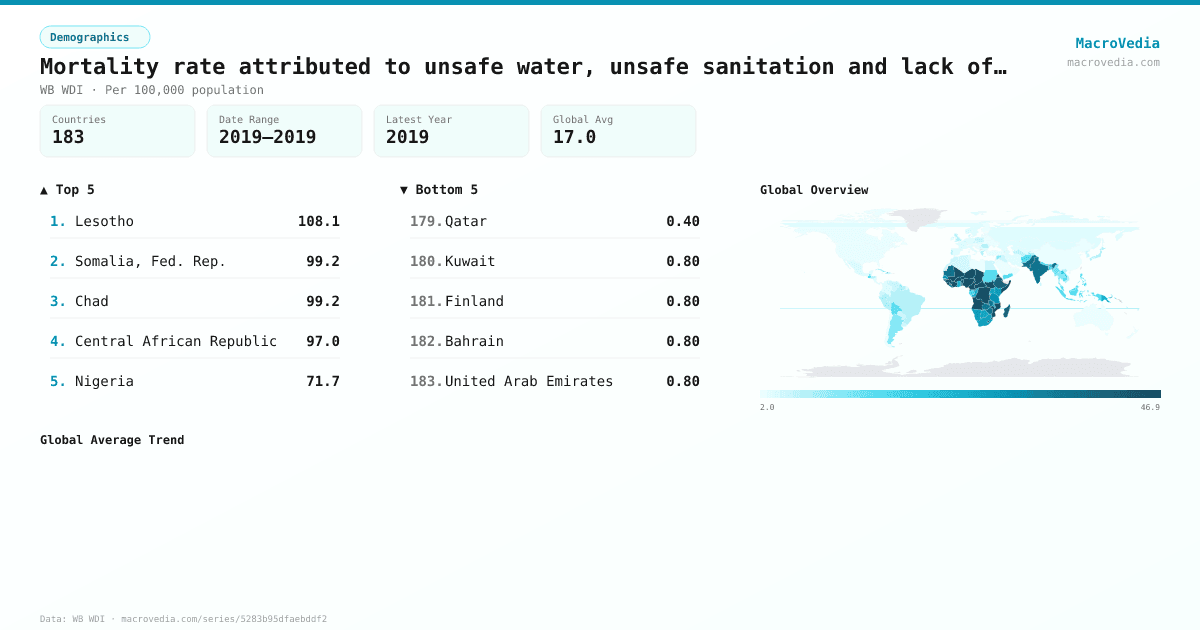
Mortality rate attributed to unsafe water, unsafe sanitation and lack of hygiene (per 100,000 population)
DemographicsWB WDIwb_wdi:SH.STA.WASH.P5•Per 100,000 population•2019 → 2019•183 countries
Series quick facts
High-level context for this country series.
DemographicsWB WDI
Coverage
183
Frequency
—
Range
2019 \u2192 2019
Latest
2019
Mortality rate attributed to unsafe water, unsafe sanitation and lack of hygiene (per 100,000 population) by country
Latest available value per country (as of 2019)
Low \u2192 High
Unit: Per 100,000 population
≤ 2.3
2.3 – 3.2
3.2 – 4.8
4.8 – 8.4
8.4 – 18.2
18.2 – 37.8
> 37.8
No data
Generated by MacroVedia.comSource: World Bank (WB WDI)
Highest 15 countries
Mortality rate attributed to unsafe water, unsafe sanitation and lack of hygiene (per 100,000 population)
50 countries with data
Generated by MacroVedia.comSource: World Bank (WB WDI)
Distribution across countries
Mortality rate attributed to unsafe water, unsafe sanitation and lack of hygiene (per 100,000 population)
Countries
50
Median
39.5
Mean
46.5
25th pctl
29.7
75th pctl
57.8
Generated by MacroVedia.comSource: World Bank (WB WDI)
Compare trends
Mortality rate attributed to unsafe water, unsafe sanitation and lack of hygiene (per 100,000 population)
LesothoSomalia, Fed. Rep.Chad
Generated by MacroVedia.comSource: World Bank (WB WDI)
| Country | Latest | Date | Trend |
|---|---|---|---|
| LesothoLSO | 108.1 Per 100,000 population | 2019 | — |
| Somalia, Fed. Rep.SOM | 99.2 Per 100,000 population | 2019 | — |
| ChadTCD | 99.2 Per 100,000 population | 2019 | — |
| Central African RepublicCAF | 97 Per 100,000 population | 2019 | — |
| NigeriaNGA | 71.7 Per 100,000 population | 2019 | — |
| NigerNER | 70.3 Per 100,000 population | 2019 | — |
| Sierra LeoneSLE | 69.5 Per 100,000 population | 2019 | — |
| South SudanSSD | 68.1 Per 100,000 population | 2019 | — |
| EritreaERI | 66.5 Per 100,000 population | 2019 | — |
| MaliMLI | 66.1 Per 100,000 population | 2019 | — |
| Burkina FasoBFA | 60.9 Per 100,000 population | 2019 | — |
| BeninBEN | 60.2 Per 100,000 population | 2019 | — |
| GuineaGIN | 57.8 Per 100,000 population | 2019 | — |
| BurundiBDI | 53.3 Per 100,000 population | 2019 | — |
| Congo, Dem. Rep.COD | 52.3 Per 100,000 population | 2019 | — |
| Guinea-BissauGNB | 49.4 Per 100,000 population | 2019 | — |
| AngolaAGO | 48.9 Per 100,000 population | 2019 | — |
| CameroonCMR | 47.3 Per 100,000 population | 2019 | — |
| Cote d'IvoireCIV | 47 Per 100,000 population | 2019 | — |
| EswatiniSWZ | 46.5 Per 100,000 population | 2019 | — |
| MozambiqueMOZ | 45.6 Per 100,000 population | 2019 | — |
| ComorosCOM | 43.8 Per 100,000 population | 2019 | — |
| TogoTGO | 42.4 Per 100,000 population | 2019 | — |
| EthiopiaETH | 40.7 Per 100,000 population | 2019 | — |
| MadagascarMDG | 40.1 Per 100,000 population | 2019 | — |
| PakistanPAK | 38.8 Per 100,000 population | 2019 | — |
| MauritaniaMRT | 37.8 Per 100,000 population | 2019 | — |
| DjiboutiDJI | 37.6 Per 100,000 population | 2019 | — |
| KiribatiKIR | 37.4 Per 100,000 population | 2019 | — |
| IndiaIND | 36.4 Per 100,000 population | 2019 | — |
| ZimbabweZWE | 36.2 Per 100,000 population | 2019 | — |
| ZambiaZMB | 35.8 Per 100,000 population | 2019 | — |
| LiberiaLBR | 34.6 Per 100,000 population | 2019 | — |
| Solomon IslandsSLB | 32.7 Per 100,000 population | 2019 | — |
| SenegalSEN | 31.7 Per 100,000 population | 2019 | — |
| MalawiMWI | 30.8 Per 100,000 population | 2019 | — |
| TanzaniaTZA | 30.2 Per 100,000 population | 2019 | — |
| Equatorial GuineaGNQ | 29.7 Per 100,000 population | 2019 | — |
| Gambia, TheGMB | 29.5 Per 100,000 population | 2019 | — |
| KenyaKEN | 29 Per 100,000 population | 2019 | — |
| NamibiaNAM | 28.8 Per 100,000 population | 2019 | — |
| UgandaUGA | 28.1 Per 100,000 population | 2019 | — |
| South AfricaZAF | 27.6 Per 100,000 population | 2019 | — |
| BotswanaBWA | 26.8 Per 100,000 population | 2019 | — |
| Congo, Rep.COG | 26.4 Per 100,000 population | 2019 | — |
| HaitiHTI | 25.9 Per 100,000 population | 2019 | — |
| GhanaGHA | 25.2 Per 100,000 population | 2019 | — |
| RwandaRWA | 25 Per 100,000 population | 2019 | — |
| VanuatuVUT | 25 Per 100,000 population | 2019 | — |
| Papua New GuineaPNG | 24.9 Per 100,000 population | 2019 | — |
Source: World Bank (WB WDI)