Incidence of tuberculosis (per 100 000 population per year)
DemographicsWHO GHOwho_gho:MDG_0000000020•Per 100,000 population•2000 → 2024•195 countries
Series quick facts
High-level context for this country series.
DemographicsWHO GHO
Coverage
195
Frequency
yearly
Range
2000 \u2192 2024
Latest
2024
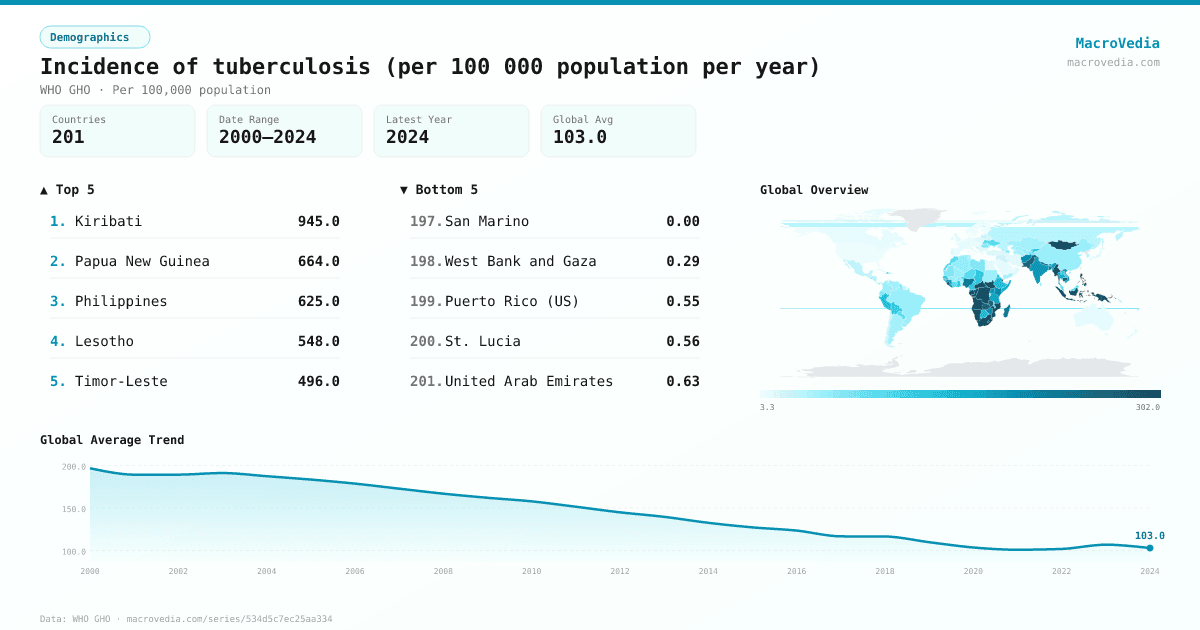
Incidence of tuberculosis (per 100 000 population per year) by country
Latest available value per country (as of 2024)
Low \u2192 High
Unit: Per 100,000 population
≤ 4.9
4.9 – 11.43
11.43 – 35.29
35.29 – 59
59 – 120.86
120.86 – 221.57
> 221.57
No data
Generated by MacroVedia.comSource: World Health Organization (WHO GHO)
Highest 15 countries
Incidence of tuberculosis (per 100 000 population per year)
50 countries with data
Generated by MacroVedia.comSource: World Health Organization (WHO GHO)
Distribution across countries
Incidence of tuberculosis (per 100 000 population per year)
Countries
50
Median
245.5
Mean
314.4
25th pctl
187
75th pctl
382
Generated by MacroVedia.comSource: World Health Organization (WHO GHO)
Compare trends
Incidence of tuberculosis (per 100 000 population per year)
KiribatiPapua New GuineaPhilippines
Generated by MacroVedia.comSource: World Health Organization (WHO GHO)
| Country | Latest | Date | Trend |
|---|---|---|---|
| KiribatiKIR | 945 Per 100,000 population | 2024 | |
| Marshall IslandsMHL | 928 Per 100,000 population | 2023 | |
| Papua New GuineaPNG | 664 Per 100,000 population | 2024 | |
| PhilippinesPHL | 625 Per 100,000 population | 2024 | |
| LesothoLSO | 548 Per 100,000 population | 2024 | |
| Timor-LesteTLS | 496 Per 100,000 population | 2024 | |
| DjiboutiDJI | 495 Per 100,000 population | 2024 | |
| MyanmarMMR | 482 Per 100,000 population | 2024 | |
| MongoliaMNG | 446 Per 100,000 population | 2024 | |
| NamibiaNAM | 422 Per 100,000 population | 2024 | |
| Central African RepublicCAF | 419 Per 100,000 population | 2024 | |
| South AfricaZAF | 389 Per 100,000 population | 2024 | |
| IndonesiaIDN | 382 Per 100,000 population | 2024 | |
| Congo, Dem. Rep.COD | 377 Per 100,000 population | 2024 | |
| AngolaAGO | 373 Per 100,000 population | 2024 | |
| Sierra LeoneSLE | 372 Per 100,000 population | 2024 | |
| GabonGAB | 371 Per 100,000 population | 2024 | |
| MozambiqueMOZ | 361 Per 100,000 population | 2024 | |
| South SudanSSD | 320 Per 100,000 population | 2024 | |
| EswatiniSWZ | 319 Per 100,000 population | 2024 | |
| Congo, Rep.COG | 302 Per 100,000 population | 2024 | |
| CambodiaKHM | 272 Per 100,000 population | 2024 | |
| ZambiaZMB | 272 Per 100,000 population | 2024 | |
| PakistanPAK | 266 Per 100,000 population | 2024 | |
| Micronesia, Fed. Sts.FSM | 264 Per 100,000 population | 2024 | |
| NepalNPL | 227 Per 100,000 population | 2024 | |
| MadagascarMDG | 224 Per 100,000 population | 2024 | |
| TuvaluTUV | 223 Per 100,000 population | 2024 | |
| BangladeshBGD | 221 Per 100,000 population | 2024 | |
| NigeriaNGA | 219 Per 100,000 population | 2024 | |
| KenyaKEN | 207 Per 100,000 population | 2024 | |
| LiberiaLBR | 207 Per 100,000 population | 2024 | |
| AfghanistanAFG | 203 Per 100,000 population | 2024 | |
| ZimbabweZWE | 203 Per 100,000 population | 2024 | |
| Equatorial GuineaGNQ | 199 Per 100,000 population | 2024 | |
| UgandaUGA | 197 Per 100,000 population | 2024 | |
| BhutanBTN | 191 Per 100,000 population | 2024 | |
| IndiaIND | 187 Per 100,000 population | 2024 | |
| Viet NamVNM | 182 Per 100,000 population | 2024 | |
| GuineaGIN | 178 Per 100,000 population | 2024 | |
| Guinea-BissauGNB | 176 Per 100,000 population | 2024 | |
| HaitiHTI | 175 Per 100,000 population | 2024 | |
| TanzaniaTZA | 172 Per 100,000 population | 2024 | |
| NauruNRU | 161 Per 100,000 population | 2024 | |
| Somalia, Fed. Rep.SOM | 151 Per 100,000 population | 2024 | |
| ThailandTHA | 146 Per 100,000 population | 2024 | |
| BotswanaBWA | 143 Per 100,000 population | 2024 | |
| EthiopiaETH | 141 Per 100,000 population | 2024 | |
| PeruPER | 139 Per 100,000 population | 2024 | |
| Gambia, TheGMB | 138 Per 100,000 population | 2024 |
Source: World Health Organization (WHO GHO)