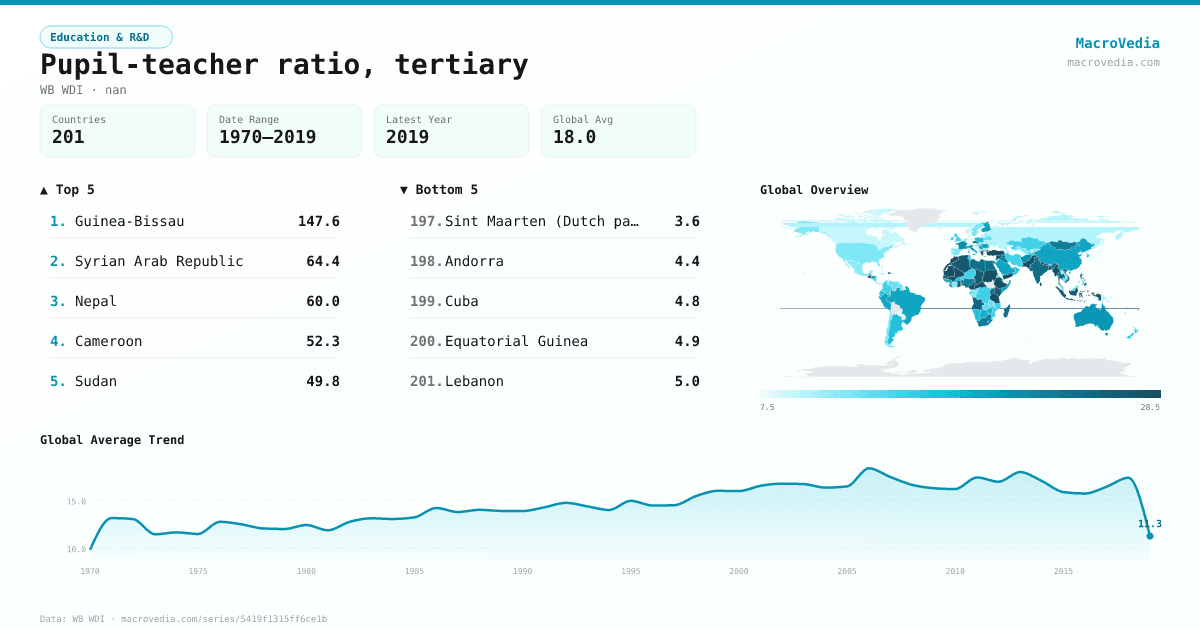
Pupil-teacher ratio, tertiary
Education & R&DWB WDIwb_wdi:SE.TER.ENRL.TC.ZS•nan•1970 → 2019•201 countries
Series quick facts
High-level context for this country series.
Education & R&DWB WDI
Coverage
201
Frequency
—
Range
1970 \u2192 2019
Latest
2018
Pupil-teacher ratio, tertiary by country
Latest available value per country (as of 2018)
Low \u2192 High
Unit: nan
≤ 8.52
8.52 – 11.69
11.69 – 14.06
14.06 – 16.98
16.98 – 21.52
21.52 – 27.28
> 27.28
No data
Generated by MacroVedia.comSource: World Bank (WB WDI)
Highest 15 countries
Pupil-teacher ratio, tertiary
50 countries with data
Generated by MacroVedia.comSource: World Bank (WB WDI)
Distribution across countries
Pupil-teacher ratio, tertiary
Countries
50
Median
27.9
Mean
33.9
25th pctl
24.9
75th pctl
34.4
Generated by MacroVedia.comSource: World Bank (WB WDI)
Compare trends
Pupil-teacher ratio, tertiary
IndonesiaTurkiyeMadagascar
Generated by MacroVedia.comSource: World Bank (WB WDI)
| Country | Latest | Date | Trend |
|---|---|---|---|
| Guinea-BissauGNB | 147.56 nan | 2006 | — |
| Syrian Arab RepublicSYR | 64.41 nan | 2015 | |
| NepalNPL | 60.01 nan | 2013 | |
| CameroonCMR | 52.28 nan | 2014 | |
| Timor-LesteTLS | 51.62 nan | 2002 | — |
| SudanSDN | 49.85 nan | 2015 | |
| TurkiyeTUR | 47.44 nan | 2017 | |
| MauritaniaMRT | 42.95 nan | 2013 | |
| GreeceGRC | 38.75 nan | 2017 | |
| BangladeshBGD | 37.12 nan | 2018 | |
| MyanmarMMR | 35.52 nan | 2018 | |
| Central African RepublicCAF | 34.61 nan | 2011 | |
| TanzaniaTZA | 34.45 nan | 2012 | |
| PakistanPAK | 33.02 nan | 2018 | |
| Yemen, Rep.YEM | 32.21 nan | 2007 | |
| EswatiniSWZ | 32.14 nan | 2011 | |
| EthiopiaETH | 31.22 nan | 2014 | |
| MaliMLI | 30.82 nan | 2017 | |
| MauritiusMUS | 30.39 nan | 2010 | |
| Sri LankaLKA | 29.76 nan | 2018 | |
| BeninBEN | 29.49 nan | 2017 | |
| MoroccoMAR | 28.74 nan | 2018 | |
| FijiFJI | 28.55 nan | 1991 | |
| GuamGUM | 28.08 nan | 1989 | |
| SenegalSEN | 27.94 nan | 2018 | |
| West Bank and GazaPSE | 27.88 nan | 2018 | |
| GuatemalaGTM | 27.71 nan | 2002 | |
| Dominican RepublicDOM | 27.43 nan | 2017 | |
| AlgeriaDZA | 27.29 nan | 2018 | |
| IndonesiaIDN | 27.26 nan | 2018 | |
| KenyaKEN | 27 nan | 2017 | |
| Cayman IslandsCYM | 26.82 nan | 2008 | |
| GhanaGHA | 26.52 nan | 2018 | |
| ChadTCD | 26.39 nan | 2015 | |
| ComorosCOM | 26.31 nan | 2014 | |
| CzechiaCZE | 26.02 nan | 2013 | |
| AngolaAGO | 25.52 nan | 2015 | |
| VanuatuVUT | 24.86 nan | 2002 | |
| MadagascarMDG | 24.76 nan | 2018 | |
| RwandaRWA | 24.74 nan | 2018 | |
| IndiaIND | 24.73 nan | 2018 | |
| ThailandTHA | 24.64 nan | 2016 | |
| Viet NamVNM | 24.59 nan | 2016 | |
| UgandaUGA | 24.47 nan | 2011 | |
| Egypt, Arab Rep.EGY | 23.87 nan | 2014 | |
| LibyaLBY | 23.87 nan | 2003 | |
| PhilippinesPHL | 23.73 nan | 2017 | |
| St. Vincent and the GrenadinesVCT | 23.38 nan | 1987 | |
| Gambia, TheGMB | 23.15 nan | 2012 | |
| MongoliaMNG | 23.09 nan | 2018 |
Source: World Bank (WB WDI)