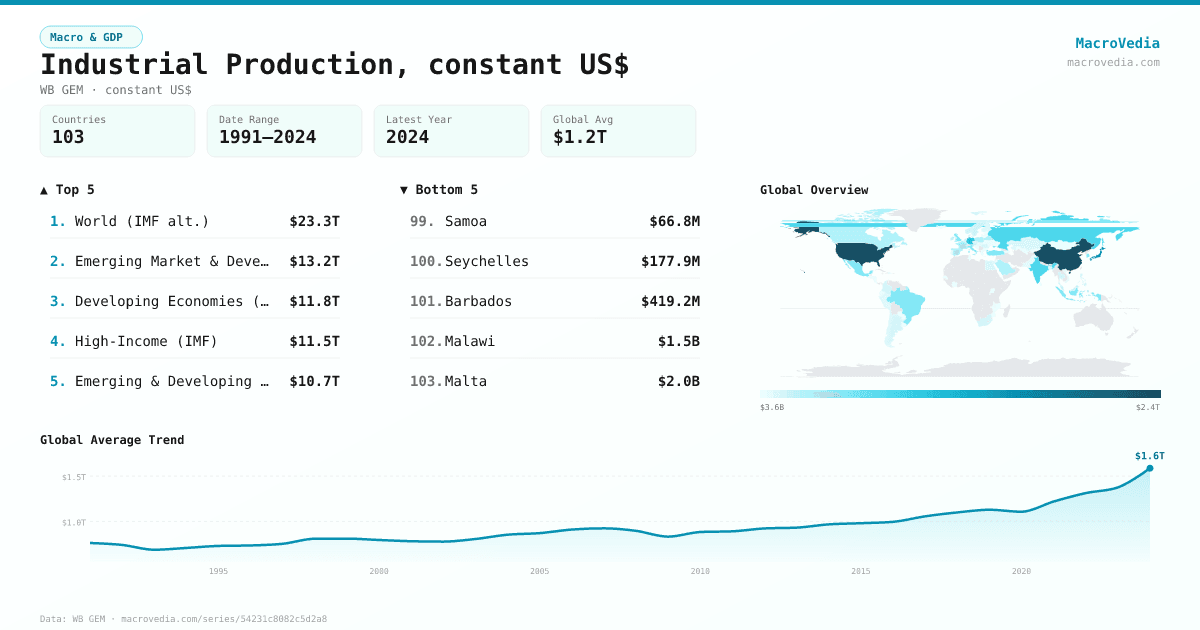
Industrial Production, constant US$
Macro & GDPWB GEMwb_gem:IPTOTNSKD•constant US$•1991 → 2024•89 countries
Series quick facts
High-level context for this country series.
Macro & GDPWB GEM
Coverage
89
Frequency
yearly
Range
1991 \u2192 2024
Latest
2024
Industrial Production, constant US$ by country
Latest available value per country (as of 2024)
Low \u2192 High
Unit: US$
≤ 4.77B
4.77B – 13.71B
13.71B – 25.85B
25.85B – 87.97B
87.97B – 141.04B
141.04B – 411.79B
> 411.79B
No data
Generated by MacroVedia.comSource: World Bank (WB GEM)
Highest 15 countries
Industrial Production, constant US$
50 countries with data
Generated by MacroVedia.comSource: World Bank (WB GEM)
Distribution across countries
Industrial Production, constant US$
Countries
50
Median
$143.24B
Mean
$468.89B
25th pctl
$89.57B
75th pctl
$474.86B
Generated by MacroVedia.comSource: World Bank (WB GEM)
Compare trends
Industrial Production, constant US$
United StatesJapanGermany
Generated by MacroVedia.comSource: World Bank (WB GEM)
| Country | Latest | Date | Trend |
|---|---|---|---|
| ChinaCHN | $7.38T | 2024 | |
| United StatesUSA | $3.35T | 2024 | |
| JapanJPN | $1.62T | 2024 | |
| GermanyDEU | $1.04T | 2024 | |
| IndiaIND | $785.74B | 2024 | |
| Russian FederationRUS | $781.86B | 2024 | |
| Korea, Rep.KOR | $530.26B | 2024 | |
| IndonesiaIDN | $525.04B | 2024 | |
| MexicoMEX | $504.4B | 2024 | |
| BrazilBRA | $499.16B | 2024 | |
| TurkiyeTUR | $483.43B | 2024 | |
| ItalyITA | $481.49B | 2024 | |
| United KingdomGBR | $474.86B | 2024 | |
| FranceFRA | $364.49B | 2024 | |
| SpainESP | $352.43B | 2024 | |
| BelarusBLR | $306.79B | 2024 | |
| Saudi ArabiaSAU | $304.22B | 2023 | |
| PolandPOL | $289.72B | 2024 | |
| CanadaCAN | $262.84B | 2022 | |
| IrelandIRL | $201.21B | 2022 | |
| AustriaAUT | $173.46B | 2024 | |
| NetherlandsNLD | $160.72B | 2024 | |
| MalaysiaMYS | $160.52B | 2024 | |
| SwedenSWE | $151.44B | 2024 | |
| ThailandTHA | $145.43B | 2024 | |
| BelgiumBEL | $141.06B | 2024 | |
| NorwayNOR | $140.93B | 2024 | |
| PhilippinesPHL | $131.94B | 2024 | |
| South AfricaZAF | $123.67B | 2024 | |
| SingaporeSGP | $116B | 2024 | |
| DenmarkDNK | $113.01B | 2024 | |
| ColombiaCOL | $110.89B | 2024 | |
| ArgentinaARG | $104.35B | 2023 | |
| RomaniaROU | $103.16B | 2024 | |
| CzechiaCZE | $102.36B | 2024 | |
| BangladeshBGD | $96.13B | 2021 | |
| Egypt, Arab Rep.EGY | $92.71B | 2024 | |
| KazakhstanKAZ | $89.57B | 2024 | |
| ChileCHL | $87.34B | 2024 | |
| FinlandFIN | $77.86B | 2024 | |
| QatarQAT | $77.23B | 2023 | |
| PeruPER | $63.32B | 2024 | |
| IsraelISR | $58.14B | 2024 | |
| HungaryHUN | $52.54B | 2024 | |
| PakistanPAK | $49.41B | 2024 | |
| Viet NamVNM | $48.51B | 2024 | |
| PortugalPRT | $44.8B | 2024 | |
| Slovak RepublicSVK | $36.79B | 2024 | |
| EcuadorECU | $29.97B | 2019 | |
| GreeceGRC | $28.39B | 2024 |
Source: World Bank (WB GEM)