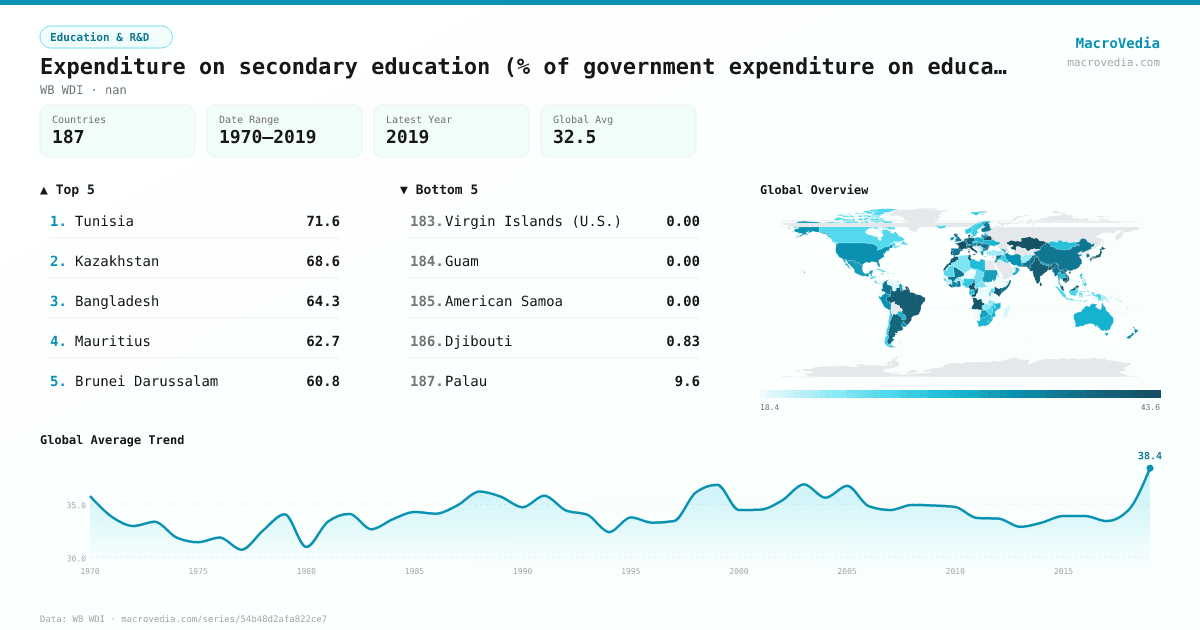
Expenditure on secondary education (% of government expenditure on education)
Education & R&DWB WDIwb_wdi:SE.XPD.SECO.ZS•nan•1970 → 2019•187 countries
Series quick facts
High-level context for this country series.
Education & R&DWB WDI
Coverage
187
Frequency
yearly
Range
1970 \u2192 2019
Latest
2018
Expenditure on secondary education (% of government expenditure on education) by country
Latest available value per country (as of 2018)
Low \u2192 High
Unit: %
≤ 22.18%
22.18% – 27.45%
27.45% – 31.26%
31.26% – 34.53%
34.53% – 38.57%
38.57% – 41.95%
> 41.95%
No data
Generated by MacroVedia.comSource: World Bank (WB WDI)
Highest 15 countries
Expenditure on secondary education (% of government expenditure on education)
50 countries with data
Generated by MacroVedia.comSource: World Bank (WB WDI)
Distribution across countries
Expenditure on secondary education (% of government expenditure on education)
Countries
50
Median
42.2%
Mean
45.8%
25th pctl
40.3%
75th pctl
48.4%
Generated by MacroVedia.comSource: World Bank (WB WDI)
Compare trends
Expenditure on secondary education (% of government expenditure on education)
HungaryAustriaCyprus
Generated by MacroVedia.comSource: World Bank (WB WDI)
| Country | Latest | Date | Trend |
|---|---|---|---|
| TunisiaTUN | 71.59% | 2015 | |
| KazakhstanKAZ | 68.56% | 2016 | |
| BangladeshBGD | 64.33% | 2016 | |
| MauritiusMUS | 62.72% | 2018 | |
| Brunei DarussalamBRN | 60.84% | 2016 | |
| TuvaluTUV | 59.02% | 1990 | — |
| Cayman IslandsCYM | 54.03% | 2006 | |
| LiberiaLBR | 53.44% | 2018 | |
| Congo, Rep.COG | 53.33% | 2010 | |
| CameroonCMR | 52.55% | 2012 | |
| BelarusBLR | 50.46% | 2017 | — |
| FranceFRA | 50.02% | 1999 | |
| Antigua and BarbudaATG | 48.39% | 2009 | |
| LiechtensteinLIE | 47.43% | 2011 | |
| ArmeniaARM | 46.87% | 2017 | |
| Sri LankaLKA | 45.74% | 2018 | |
| BermudaBMU | 44.39% | 2017 | |
| BahrainBHR | 44.22% | 2015 | |
| CambodiaKHM | 44.05% | 2014 | |
| DominicaDMA | 43.37% | 2015 | |
| SamoaWSM | 42.81% | 2016 | |
| ItalyITA | 42.74% | 2015 | |
| PortugalPRT | 42.61% | 2015 | |
| AngolaAGO | 42.42% | 2006 | |
| Slovak RepublicSVK | 42.18% | 2016 | |
| BelgiumBEL | 42.13% | 2013 | |
| JapanJPN | 41.98% | 2016 | |
| MoroccoMAR | 41.93% | 2009 | |
| KenyaKEN | 41.76% | 2015 | |
| BhutanBTN | 41.49% | 2015 | |
| BrazilBRA | 41.37% | 2015 | |
| MalaysiaMYS | 41.37% | 2018 | |
| IndiaIND | 41.35% | 2013 | |
| GermanyDEU | 41.26% | 2016 | |
| CyprusCYP | 40.95% | 2016 | |
| LuxembourgLUX | 40.71% | 2015 | |
| NetherlandsNLD | 40.49% | 2016 | |
| St. LuciaLCA | 40.27% | 2018 | |
| St. Kitts and NevisKNA | 40.24% | 2015 | |
| HungaryHUN | 40.2% | 2016 | |
| DenmarkDNK | 40% | 2014 | |
| BelizeBLZ | 39.95% | 2017 | |
| Cabo VerdeCPV | 39.93% | 2017 | |
| AustriaAUT | 39.63% | 2016 | |
| Viet NamVNM | 39.57% | 2013 | |
| ArgentinaARG | 39.54% | 2017 | |
| Turks and Caicos IslandsTCA | 39.45% | 2018 | |
| BarbadosBRB | 39.31% | 2016 | |
| RomaniaROU | 39.09% | 2016 | |
| BulgariaBGR | 38.91% | 2013 |
Source: World Bank (WB WDI)