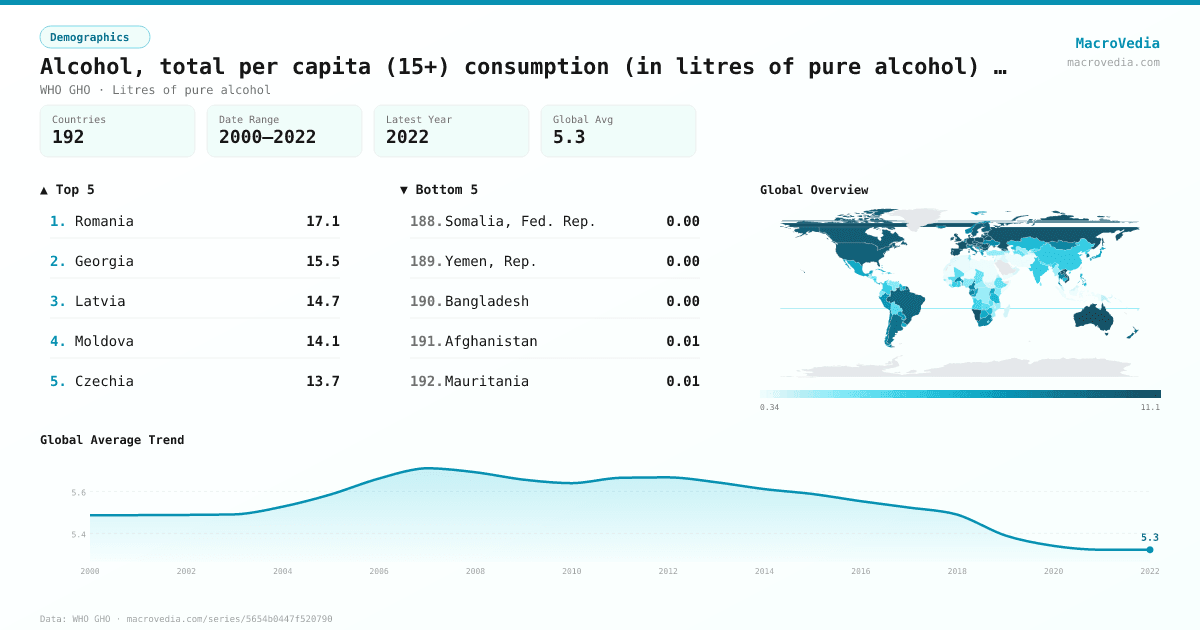
Alcohol, total per capita (15+) consumption (in litres of pure alcohol) (SDG Indicator 3.5.2), three-year average
DemographicsWHO GHOwho_gho:SA_0000001688•Litres of pure alcohol•2000 → 2022•187 countries
Series quick facts
High-level context for this country series.
DemographicsWHO GHO
Coverage
187
Frequency
yearly
Range
2000 \u2192 2022
Latest
2022
Alcohol, total per capita (15+) consumption (in litres of pure alcohol) (SDG Indicator 3.5.2), three-year average by country
Latest available value per country (as of 2022)
Low \u2192 High
Unit: Litres of pure alcohol
≤ 679.45
679.45 – 2.12K
2.12K – 3.9K
3.9K – 5.81K
5.81K – 7.72K
7.72K – 10.62K
> 10.62K
No data
Generated by MacroVedia.comSource: World Health Organization (WHO GHO)
Highest 15 countries
Alcohol, total per capita (15+) consumption (in litres of pure alcohol) (SDG Indicator 3.5.2), three-year average
50 countries with data
Generated by MacroVedia.comSource: World Health Organization (WHO GHO)
Distribution across countries
Alcohol, total per capita (15+) consumption (in litres of pure alcohol) (SDG Indicator 3.5.2), three-year average
Countries
50
Median
10.8K
Mean
10.7K
25th pctl
9.4K
75th pctl
11.4K
Generated by MacroVedia.comSource: World Health Organization (WHO GHO)
Compare trends
Alcohol, total per capita (15+) consumption (in litres of pure alcohol) (SDG Indicator 3.5.2), three-year average
RomaniaGeorgiaLatvia
Generated by MacroVedia.comSource: World Health Organization (WHO GHO)
| Country | Latest | Date | Trend |
|---|---|---|---|
| RomaniaROU | 17.06K Litres of pure alcohol | 2022 | |
| GeorgiaGEO | 15.54K Litres of pure alcohol | 2022 | |
| LatviaLVA | 14.73K Litres of pure alcohol | 2022 | |
| MoldovaMDA | 14.13K Litres of pure alcohol | 2022 | |
| CzechiaCZE | 13.68K Litres of pure alcohol | 2022 | |
| LithuaniaLTU | 12.18K Litres of pure alcohol | 2022 | |
| NamibiaNAM | 11.99K Litres of pure alcohol | 2022 | |
| PolandPOL | 11.92K Litres of pure alcohol | 2022 | |
| AustriaAUT | 11.85K Litres of pure alcohol | 2022 | |
| BulgariaBGR | 11.54K Litres of pure alcohol | 2022 | |
| SeychellesSYC | 11.41K Litres of pure alcohol | 2022 | |
| BelarusBLR | 11.4K Litres of pure alcohol | 2022 | |
| St. LuciaLCA | 11.39K Litres of pure alcohol | 2022 | |
| HungaryHUN | 11.25K Litres of pure alcohol | 2022 | |
| GermanyDEU | 11.24K Litres of pure alcohol | 2022 | |
| PortugalPRT | 11.22K Litres of pure alcohol | 2022 | |
| FranceFRA | 11.2K Litres of pure alcohol | 2022 | |
| Lao PDRLAO | 11.17K Litres of pure alcohol | 2022 | |
| AustraliaAUS | 11.15K Litres of pure alcohol | 2022 | |
| AndorraAND | 11.06K Litres of pure alcohol | 2022 | |
| SpainESP | 10.97K Litres of pure alcohol | 2022 | |
| Slovak RepublicSVK | 10.97K Litres of pure alcohol | 2022 | |
| SloveniaSVN | 10.9K Litres of pure alcohol | 2022 | |
| United KingdomGBR | 10.86K Litres of pure alcohol | 2022 | |
| CroatiaHRV | 10.85K Litres of pure alcohol | 2022 | |
| LuxembourgLUX | 10.8K Litres of pure alcohol | 2022 | |
| Viet NamVNM | 10.72K Litres of pure alcohol | 2022 | |
| IrelandIRL | 10.55K Litres of pure alcohol | 2022 | |
| Russian FederationRUS | 10.51K Litres of pure alcohol | 2022 | |
| EstoniaEST | 10.49K Litres of pure alcohol | 2022 | |
| CanadaCAN | 10.03K Litres of pure alcohol | 2022 | |
| DenmarkDNK | 9.97K Litres of pure alcohol | 2022 | |
| United StatesUSA | 9.81K Litres of pure alcohol | 2022 | |
| SwedenSWE | 9.61K Litres of pure alcohol | 2022 | |
| FinlandFIN | 9.51K Litres of pure alcohol | 2022 | |
| BarbadosBRB | 9.49K Litres of pure alcohol | 2022 | |
| Antigua and BarbudaATG | 9.43K Litres of pure alcohol | 2022 | |
| BrazilBRA | 9.38K Litres of pure alcohol | 2022 | |
| New ZealandNZL | 9.21K Litres of pure alcohol | 2022 | |
| SwitzerlandCHE | 9.16K Litres of pure alcohol | 2022 | |
| SerbiaSRB | 9.03K Litres of pure alcohol | 2022 | |
| ArgentinaARG | 8.84K Litres of pure alcohol | 2022 | |
| BelgiumBEL | 8.74K Litres of pure alcohol | 2022 | |
| NetherlandsNLD | 8.7K Litres of pure alcohol | 2022 | |
| Korea, Rep.KOR | 8.36K Litres of pure alcohol | 2022 | |
| ItalyITA | 8.33K Litres of pure alcohol | 2022 | |
| IcelandISL | 8.21K Litres of pure alcohol | 2022 | |
| MontenegroMNE | 8.01K Litres of pure alcohol | 2022 | |
| CameroonCMR | 7.97K Litres of pure alcohol | 2022 | |
| ChileCHL | 7.93K Litres of pure alcohol | 2022 |
Source: World Health Organization (WHO GHO)