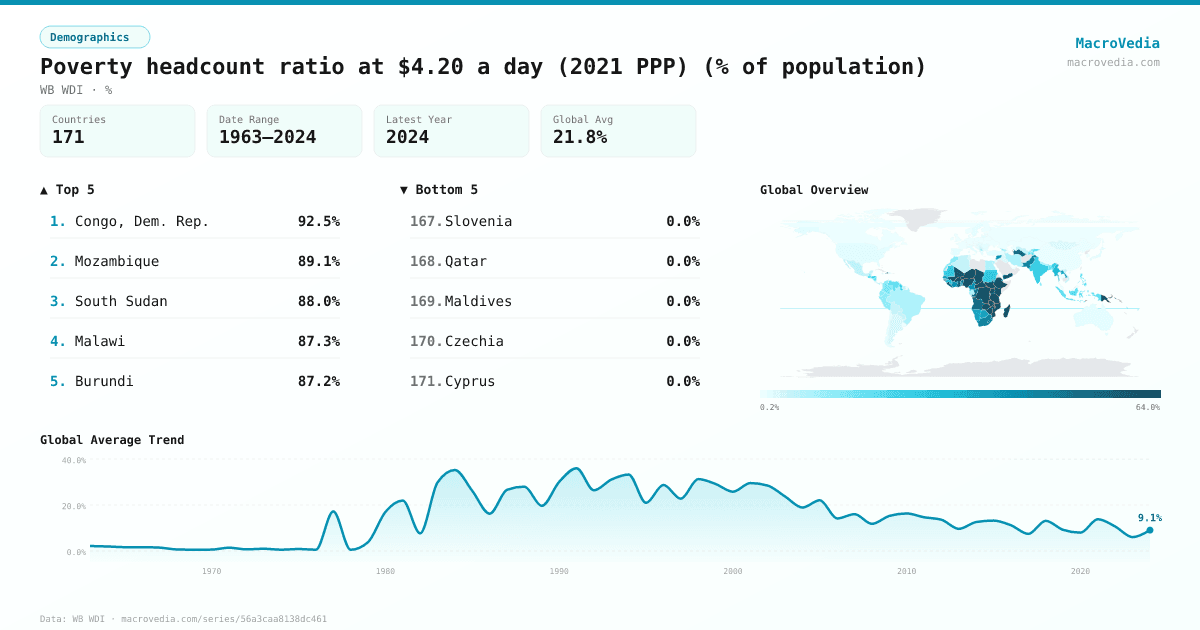
Poverty headcount ratio at $4.20 a day (2021 PPP) (% of population)
DemographicsWB WDIwb_wdi:SI.POV.LMIC•%•1963 → 2024•171 countries
Series quick facts
High-level context for this country series.
DemographicsWB WDI
Coverage
171
Frequency
—
Range
1963 \u2192 2024
Latest
2023
Poverty headcount ratio at $4.20 a day (2021 PPP) (% of population) by country
Latest available value per country (as of 2023)
Low \u2192 High
Unit: %
≤ 0.4%
0.4% – 1.66%
1.66% – 6.7%
6.7% – 17.93%
17.93% – 39.6%
39.6% – 59.41%
> 59.41%
No data
Generated by MacroVedia.comSource: World Bank (WB WDI)
Highest 15 countries
Poverty headcount ratio at $4.20 a day (2021 PPP) (% of population)
50 countries with data
Generated by MacroVedia.comSource: World Bank (WB WDI)
Distribution across countries
Poverty headcount ratio at $4.20 a day (2021 PPP) (% of population)
Countries
50
Median
59.4%
Mean
61.1%
25th pctl
50%
75th pctl
69.4%
Generated by MacroVedia.comSource: World Bank (WB WDI)
Compare trends
Poverty headcount ratio at $4.20 a day (2021 PPP) (% of population)
PakistanCote d'IvoireZambia
Generated by MacroVedia.comSource: World Bank (WB WDI)
| Country | Latest | Date | Trend |
|---|---|---|---|
| Congo, Dem. Rep.COD | 92.5% | 2020 | |
| MozambiqueMOZ | 89.1% | 2022 | |
| South SudanSSD | 88% | 2016 | |
| MalawiMWI | 87.3% | 2019 | |
| BurundiBDI | 87.2% | 2020 | |
| Central African RepublicCAF | 83.9% | 2021 | |
| MadagascarMDG | 83.9% | 2021 | |
| ZambiaZMB | 81.4% | 2022 | |
| NigerNER | 79.7% | 2021 | |
| UgandaUGA | 76.3% | 2019 | |
| Timor-LesteTLS | 71.3% | 2014 | |
| TanzaniaTZA | 70% | 2018 | |
| Papua New GuineaPNG | 69.4% | 2009 | |
| KenyaKEN | 67% | 2022 | |
| Sierra LeoneSLE | 65% | 2018 | |
| Burkina FasoBFA | 64.6% | 2021 | |
| ZimbabweZWE | 64.6% | 2019 | |
| NigeriaNGA | 64% | 2022 | |
| EthiopiaETH | 63.7% | 2021 | |
| Solomon IslandsSLB | 62.9% | 2012 | |
| RwandaRWA | 62.2% | 2023 | |
| Guinea-BissauGNB | 62.1% | 2021 | |
| ChadTCD | 61.4% | 2022 | |
| St. LuciaLCA | 59.7% | 1995 | — |
| MaliMLI | 59.5% | 2021 | |
| HaitiHTI | 59.2% | 2012 | |
| EswatiniSWZ | 58.3% | 2016 | |
| IndiaIND | 57.7% | 2011 | |
| Yemen, Rep.YEM | 57.7% | 2014 | |
| LesothoLSO | 56.8% | 2017 | |
| GhanaGHA | 56.3% | 2016 | |
| TurkmenistanTKM | 55.6% | 1998 | — |
| TogoTGO | 55.3% | 2021 | |
| Congo, Rep.COG | 55% | 2011 | |
| LiberiaLBR | 55% | 2016 | |
| AngolaAGO | 53.7% | 2018 | |
| GuyanaGUY | 50.3% | 1992 | — |
| BeninBEN | 50% | 2021 | |
| ComorosCOM | 47.7% | 2014 | |
| BangladeshBGD | 44.7% | 2016 | |
| PakistanPAK | 44.7% | 2018 | |
| South AfricaZAF | 44.5% | 2014 | |
| NepalNPL | 44.1% | 2010 | |
| Micronesia, Fed. Sts.FSM | 43.8% | 2013 | |
| DjiboutiDJI | 43.7% | 2017 | |
| Cote d'IvoireCIV | 41.7% | 2021 | |
| CameroonCMR | 41.3% | 2021 | |
| Gambia, TheGMB | 40.2% | 2020 | |
| KiribatiKIR | 40% | 2006 | — |
| Syrian Arab RepublicSYR | 39.3% | 2022 |
Source: World Bank (WB WDI)