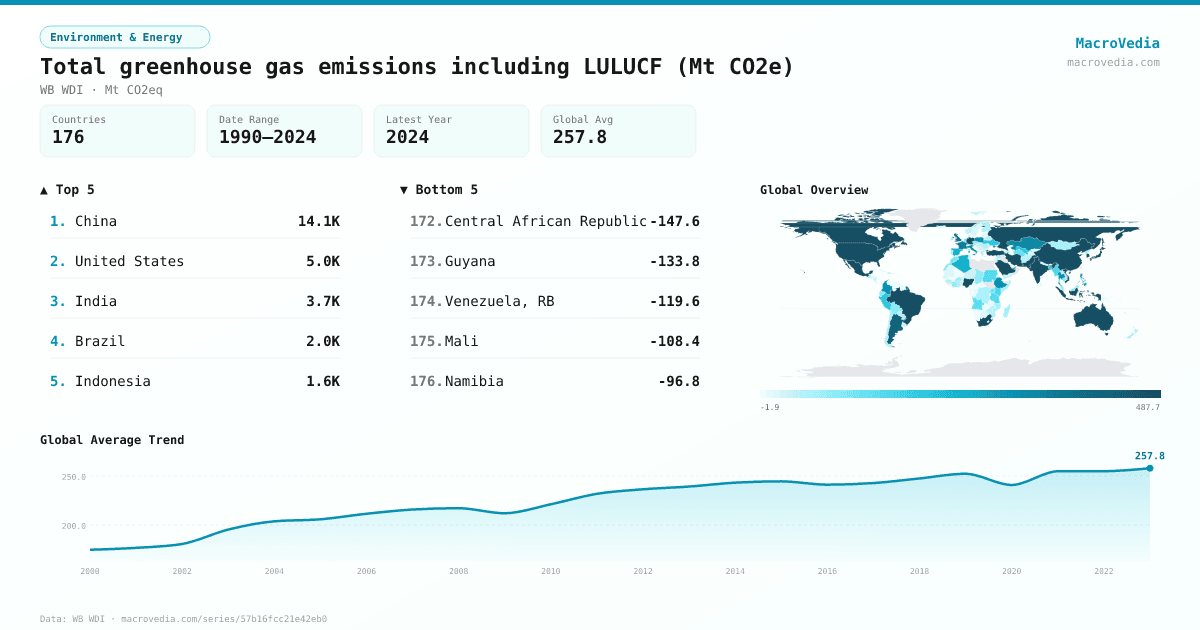
Total greenhouse gas emissions including LULUCF (Mt CO2e)
Environment & EnergyWB WDIwb_wdi:EN.GHG.ALL.LU.MT.CE.AR5•Mt CO2eq•1990 → 2024•176 countries
Series quick facts
High-level context for this country series.
Environment & EnergyWB WDI
Coverage
176
Frequency
yearly
Range
1990 \u2192 2024
Latest
2023
Total greenhouse gas emissions including LULUCF (Mt CO2e) by country
Latest available value per country (as of 2023)
Low \u2192 High
Unit: Mt CO2eq
≤ 0.04
0.04 – 9.21
9.21 – 20.81
20.81 – 52.74
52.74 – 93.35
93.35 – 318.48
> 318.48
No data
Generated by MacroVedia.comSource: World Bank (WB WDI)
Highest 15 countries
Total greenhouse gas emissions including LULUCF (Mt CO2e)
50 countries with data
Generated by MacroVedia.comSource: World Bank (WB WDI)
Distribution across countries
Total greenhouse gas emissions including LULUCF (Mt CO2e)
Countries
50
Median
318.6
Mean
861.1
25th pctl
167.1
75th pctl
563.4
Generated by MacroVedia.comSource: World Bank (WB WDI)
Compare trends
Total greenhouse gas emissions including LULUCF (Mt CO2e)
ChinaUnited StatesIndia
Generated by MacroVedia.comSource: World Bank (WB WDI)
| Country | Latest | Date | Trend |
|---|---|---|---|
| ChinaCHN | 14.07K Mt CO2eq | 2023 | |
| United StatesUSA | 4.97K Mt CO2eq | 2023 | |
| IndiaIND | 3.72K Mt CO2eq | 2023 | |
| BrazilBRA | 2.05K Mt CO2eq | 2023 | |
| IndonesiaIDN | 1.56K Mt CO2eq | 2023 | |
| Russian FederationRUS | 1.32K Mt CO2eq | 2023 | |
| Iran, Islamic Rep.IRN | 1.05K Mt CO2eq | 2023 | |
| JapanJPN | 1.04K Mt CO2eq | 2023 | |
| Saudi ArabiaSAU | 809.22 Mt CO2eq | 2023 | |
| CanadaCAN | 758.51 Mt CO2eq | 2023 | |
| GermanyDEU | 745.55 Mt CO2eq | 2023 | |
| Korea, Rep.KOR | 628.51 Mt CO2eq | 2023 | |
| NigeriaNGA | 563.38 Mt CO2eq | 2023 | |
| PakistanPAK | 550.5 Mt CO2eq | 2023 | |
| Viet NamVNM | 503.43 Mt CO2eq | 2023 | |
| South AfricaZAF | 498.74 Mt CO2eq | 2023 | |
| TurkiyeTUR | 494.68 Mt CO2eq | 2023 | |
| AustraliaAUS | 491.69 Mt CO2eq | 2023 | |
| MexicoMEX | 483.71 Mt CO2eq | 2023 | |
| ArgentinaARG | 424.71 Mt CO2eq | 2023 | |
| United KingdomGBR | 394.57 Mt CO2eq | 2023 | |
| FranceFRA | 351.89 Mt CO2eq | 2023 | |
| KazakhstanKAZ | 330.81 Mt CO2eq | 2023 | |
| ItalyITA | 324.12 Mt CO2eq | 2023 | |
| ThailandTHA | 318.67 Mt CO2eq | 2023 | |
| PolandPOL | 318.48 Mt CO2eq | 2023 | |
| ColombiaCOL | 311.49 Mt CO2eq | 2023 | |
| EthiopiaETH | 311.48 Mt CO2eq | 2023 | |
| PhilippinesPHL | 301.77 Mt CO2eq | 2023 | |
| United Arab EmiratesARE | 253.23 Mt CO2eq | 2023 | |
| AlgeriaDZA | 247.41 Mt CO2eq | 2023 | |
| SpainESP | 235.39 Mt CO2eq | 2023 | |
| BangladeshBGD | 216.21 Mt CO2eq | 2023 | |
| UzbekistanUZB | 202.91 Mt CO2eq | 2023 | |
| PeruPER | 200.05 Mt CO2eq | 2023 | |
| UkraineUKR | 190.28 Mt CO2eq | 2023 | |
| KuwaitKWT | 168.02 Mt CO2eq | 2023 | |
| MyanmarMMR | 167.14 Mt CO2eq | 2023 | |
| NetherlandsNLD | 152.6 Mt CO2eq | 2023 | |
| KenyaKEN | 147.42 Mt CO2eq | 2023 | |
| SudanSDN | 146.38 Mt CO2eq | 2023 | |
| TanzaniaTZA | 143.22 Mt CO2eq | 2023 | |
| AngolaAGO | 138.69 Mt CO2eq | 2023 | |
| TurkmenistanTKM | 127.45 Mt CO2eq | 2023 | |
| UgandaUGA | 113.07 Mt CO2eq | 2023 | |
| MoroccoMAR | 107.63 Mt CO2eq | 2023 | |
| BelgiumBEL | 106.86 Mt CO2eq | 2023 | |
| CzechiaCZE | 105.26 Mt CO2eq | 2023 | |
| EcuadorECU | 98.99 Mt CO2eq | 2023 | |
| MalaysiaMYS | 95.37 Mt CO2eq | 2023 |
Source: World Bank (WB WDI)