Research and development expenditure (% of GDP)
Macro & GDPUNESCO UISunesco_uis:GB.XPD.RSDV.GD.ZS•% of GDP•2000 → 2023•155 countries
Series quick facts
High-level context for this country series.
Macro & GDPUNESCO UIS
Coverage
155
Frequency
yearly
Range
2000 \u2192 2023
Latest
2023
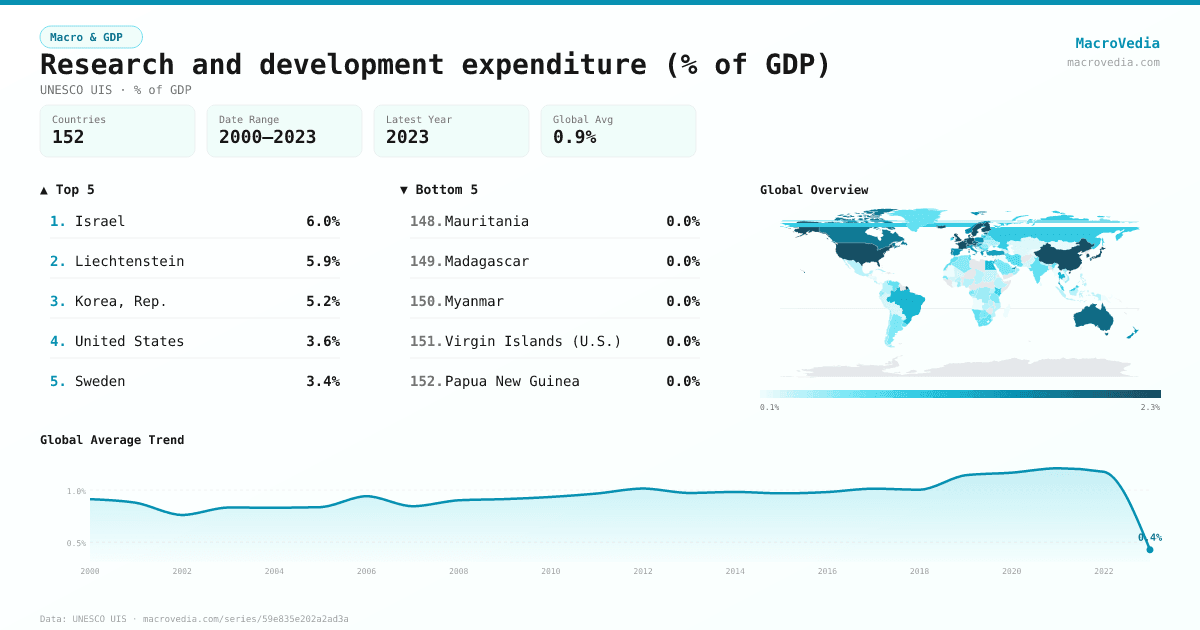
Research and development expenditure (% of GDP) by country
Latest available value per country (as of 2023)
Low \u2192 High
Unit: %
≤ 0.1%
0.1% – 0.23%
0.23% – 0.36%
0.36% – 0.58%
0.58% – 0.95%
0.95% – 1.86%
> 1.86%
No data
Generated by MacroVedia.comSource: UNESCO Institute for Statistics (UNESCO UIS)
Highest 15 countries
Research and development expenditure (% of GDP)
50 countries with data
Generated by MacroVedia.comSource: UNESCO Institute for Statistics (UNESCO UIS)
Distribution across countries
Research and development expenditure (% of GDP)
Countries
50
Median
1.7%
Mean
2.1%
25th pctl
1.1%
75th pctl
2.9%
Generated by MacroVedia.comSource: UNESCO Institute for Statistics (UNESCO UIS)
Compare trends
Research and development expenditure (% of GDP)
CanadaHong Kong SAR, ChinaSerbia
Generated by MacroVedia.comSource: UNESCO Institute for Statistics (UNESCO UIS)
| Country | Latest | Date | Trend |
|---|---|---|---|
| IsraelISR | 6.02% | 2022 | |
| LiechtensteinLIE | 5.87% | 2019 | — |
| Korea, Rep.KOR | 5.21% | 2022 | |
| United StatesUSA | 3.59% | 2022 | |
| SwedenSWE | 3.41% | 2022 | |
| BelgiumBEL | 3.41% | 2022 | |
| JapanJPN | 3.41% | 2022 | |
| SwitzerlandCHE | 3.31% | 2021 | |
| AustriaAUT | 3.2% | 2022 | |
| GermanyDEU | 3.13% | 2022 | |
| FinlandFIN | 2.96% | 2022 | |
| High incomeXD | 2.92% | 2022 | |
| United KingdomGBR | 2.9% | 2021 | |
| DenmarkDNK | 2.89% | 2022 | |
| IcelandISL | 2.6% | 2022 | |
| ChinaCHN | 2.56% | 2022 | |
| NetherlandsNLD | 2.26% | 2022 | |
| FranceFRA | 2.23% | 2022 | |
| SingaporeSGP | 2.16% | 2020 | |
| Upper middle incomeXT | 2.14% | 2022 | |
| SloveniaSVN | 2.1% | 2022 | |
| CzechiaCZE | 1.96% | 2022 | |
| AustraliaAUS | 1.86% | 2021 | |
| EstoniaEST | 1.78% | 2022 | |
| PortugalPRT | 1.7% | 2022 | |
| CanadaCAN | 1.7% | 2023 | |
| NorwayNOR | 1.56% | 2022 | |
| United Arab EmiratesARE | 1.49% | 2021 | |
| GreeceGRC | 1.49% | 2022 | |
| New ZealandNZL | 1.47% | 2021 | |
| PolandPOL | 1.45% | 2022 | |
| SpainESP | 1.44% | 2022 | |
| CroatiaHRV | 1.4% | 2022 | |
| HungaryHUN | 1.39% | 2022 | |
| ItalyITA | 1.39% | 2022 | |
| TurkiyeTUR | 1.32% | 2022 | |
| ThailandTHA | 1.16% | 2022 | |
| BrazilBRA | 1.15% | 2020 | |
| Hong Kong SAR, ChinaHKG | 1.1% | 2023 | |
| LithuaniaLTU | 1.05% | 2022 | |
| Egypt, Arab Rep.EGY | 1.03% | 2023 | |
| Slovak RepublicSVK | 0.98% | 2022 | |
| LuxembourgLUX | 0.98% | 2022 | |
| IrelandIRL | 0.96% | 2022 | |
| MalaysiaMYS | 0.95% | 2020 | |
| SerbiaSRB | 0.95% | 2023 | |
| Russian FederationRUS | 0.93% | 2022 | |
| Faroe IslandsFRO | 0.85% | 2003 | — |
| KenyaKEN | 0.81% | 2023 | |
| RwandaRWA | 0.79% | 2023 |
Source: UNESCO Institute for Statistics (UNESCO UIS)