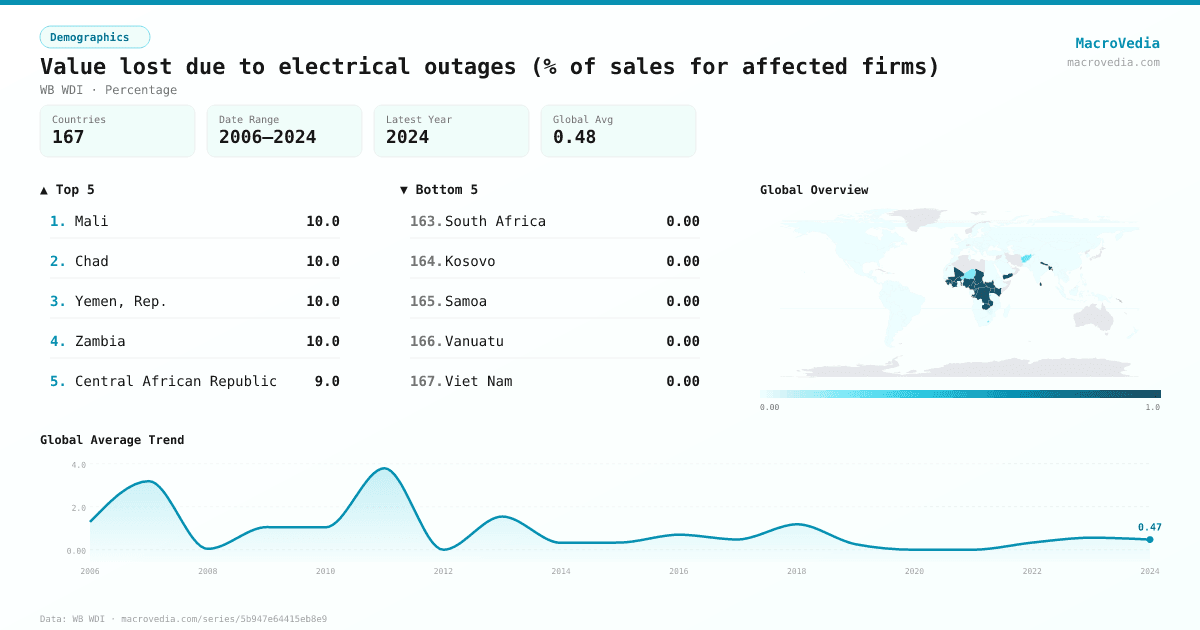
Value lost due to electrical outages (% of sales for affected firms)
DemographicsWB WDIwb_wdi:IC.FRM.OUTG.ZS•Percentage•2006 → 2024•167 countries
Series quick facts
High-level context for this country series.
DemographicsWB WDI
Coverage
167
Frequency
—
Range
2006 \u2192 2024
Latest
2024
Value lost due to electrical outages (% of sales for affected firms) by country
Latest available value per country (as of 2024)
Low \u2192 High
Unit: %
≤ 0%
0% – 0%
0% – 0%
0% – 0%
0% – 0%
0% – 2.32%
> 2.32%
No data
Generated by MacroVedia.comSource: World Bank (WB WDI)
Highest 15 countries
Value lost due to electrical outages (% of sales for affected firms)
50 countries with data
Generated by MacroVedia.comSource: World Bank (WB WDI)
Distribution across countries
Value lost due to electrical outages (% of sales for affected firms)
Countries
50
Median
2.1%
Mean
4%
25th pctl
1%
75th pctl
5%
Generated by MacroVedia.comSource: World Bank (WB WDI)
Compare trends
Value lost due to electrical outages (% of sales for affected firms)
MaliCongo, Dem. Rep.Armenia
Generated by MacroVedia.comSource: World Bank (WB WDI)
| Country | Latest | Date | Trend |
|---|---|---|---|
| PakistanPAK | 30% | 2013 | |
| GhanaGHA | 10% | 2013 | |
| GuineaGIN | 10% | 2006 | — |
| MaliMLI | 10% | 2024 | |
| ChadTCD | 10% | 2023 | |
| Yemen, Rep.YEM | 10% | 2013 | |
| ZambiaZMB | 10% | 2019 | |
| Central African RepublicCAF | 9% | 2023 | |
| AngolaAGO | 8% | 2010 | |
| Gambia, TheGMB | 7.5% | 2018 | |
| BurundiBDI | 5% | 2006 | — |
| CameroonCMR | 5% | 2016 | |
| MadagascarMDG | 5% | 2013 | |
| NepalNPL | 5% | 2013 | |
| Sierra LeoneSLE | 5% | 2017 | |
| TongaTON | 5% | 2024 | |
| UgandaUGA | 5% | 2006 | — |
| ZimbabweZWE | 5% | 2011 | — |
| KosovoXKX | 4.69% | 2013 | |
| BeninBEN | 4% | 2016 | |
| MalawiMWI | 4% | 2009 | — |
| Congo, Rep.COG | 3.44% | 2009 | — |
| NigeriaNGA | 3% | 2014 | |
| Burkina FasoBFA | 2.73% | 2024 | |
| LebanonLBN | 2.16% | 2013 | — |
| BangladeshBGD | 2% | 2022 | |
| Cote d'IvoireCIV | 2% | 2023 | |
| Congo, Dem. Rep.COD | 2% | 2024 | |
| KenyaKEN | 2% | 2013 | |
| Papua New GuineaPNG | 2% | 2015 | — |
| TanzaniaTZA | 2% | 2013 | |
| NicaraguaNIC | 1.46% | 2010 | |
| EthiopiaETH | 1% | 2011 | — |
| Sri LankaLKA | 1% | 2011 | — |
| Solomon IslandsSLB | 1% | 2015 | — |
| South SudanSSD | 1% | 2024 | |
| TogoTGO | 1% | 2023 | |
| SamoaWSM | 1% | 2009 | — |
| St. Kitts and NevisKNA | 0.77% | 2010 | — |
| IraqIRQ | 0.75% | 2011 | — |
| AfghanistanAFG | 0.25% | 2014 | |
| NigerNER | 0.22% | 2017 | |
| LesothoLSO | 0.21% | 2023 | |
| MauritaniaMRT | 0.14% | 2006 | — |
| BotswanaBWA | 0.13% | 2010 | |
| Micronesia, Fed. Sts.FSM | 0.01% | 2009 | — |
| AlbaniaALB | 0% | 2019 | |
| ArgentinaARG | 0% | 2017 | |
| ArmeniaARM | 0% | 2024 | |
| Antigua and BarbudaATG | 0% | 2010 | — |
Source: World Bank (WB WDI)